An Insatiable Appetite
Teucrium | October 21, 2022
China’s Impact on the Global Wheat Balance Sheet
Jake Hanley, CMT
Managing Director, Sr. Portfolio October
21, 2022
As the war in Ukraine drags on the wheat trade remains focused on headlines, and for good reason. Prior to the war Russia and Ukraine combined accounted for approximately 30% of global wheat exports. The war has significantly disrupted the market with both Russian and Ukrainian exports down sharply year over year.[1] Wheat prices remain volatile as the market attempts to adjust for risks tied to the uncertainties of war.
Still, the global wheat balance sheet appears to be relatively healthy. Official estimates place world ending stocks[2] over 267 million metric tons.The global stocks/use ratio[3] is projected at 34%, in-line with the ten-year average.[4]Given the current supply demand outlook one could argue that the wheat supply is adequate. That is, if you believe the numbers coming out of China.
There is reason to be skeptical.
China’s Massive Wheat Inventory
China’s wheat supplies are projected to top 144 million metric tons (mmt) this crop year. That is equal to 54% of total global wheat inventories.
Chart #1
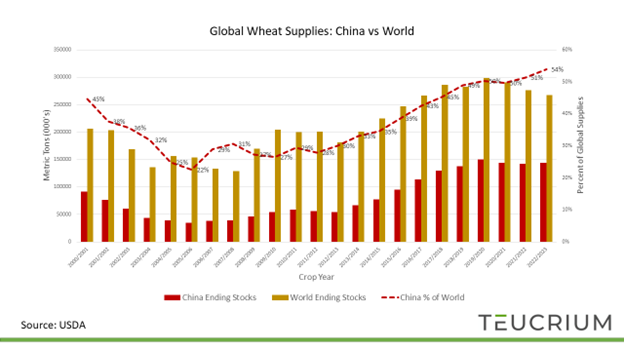
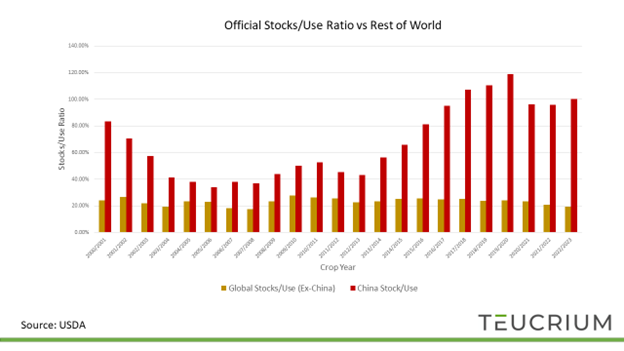
Additionally, at 144 mmt, China’s wheat stocks/use ratio is 100%. This means that a full year of Chinese wheat demand could be met from current inventory.Put another way, if production and imports both fall to zero, China has enough wheat to meet demand for a full 12 months.A stocks/use ratio of 100% is a very high number. For comparison, consider that the 5-year average stocks/use ratio for the rest of the world (i.e. ex-China) is 23.50%.
Chart #2
Based on official Chinese numbers, it appears that China’s wheat supply is more than adequate.Yet Chinese wheat imports have skyrocketed in recent years suggesting perhaps that official supply estimates may be overblown.
Record Supplies and Record Imports
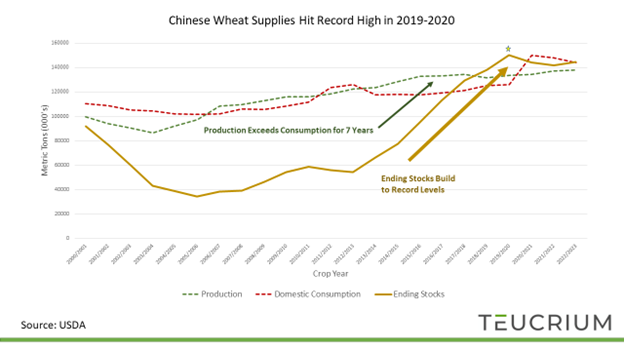
Chart #3 shows Chinese wheat production exceeding consumption between the crop years ’13-’14 and ’19- 20 (green dotted line above red dotted line).The excess production shows up as a build in ending stocks (the gold line).According to official reporting, Chinese ending stocks reached a record high of 15 mmt in ’19-‘20.
Chart #3
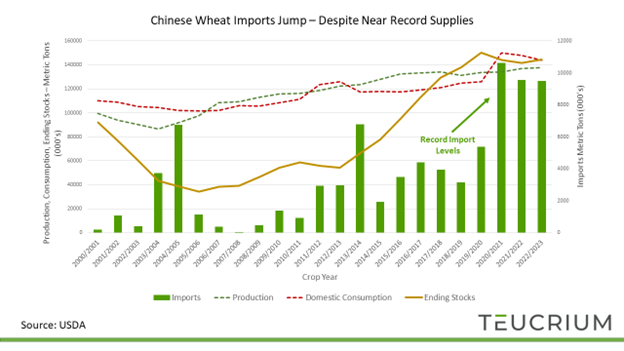
Building on the data from chart #3 we’ve added Chinese imports to chart #4.Chinese wheat imports jumped 71% between crop years ’18-’19, and ’19-‘20 then another 98% from ’19-’20 to ’21-’22.The significant jump in imports is curious given the official data shows that Chinese wheat supplies remain near record levels.
Chart #4
One potential explanation is that the official numbers are wrong and that China’s wheat balance sheet is not as healthy as it looks.The imports may be making up the difference between demand and actual supply. If true, then the global wheat supply is much tighter than it appears.
Another explanation, assuming the official numbers are accurate, is that China is aggressively building wheat supplies. Stocking food reserves is a prudent strategy in normal times, perhaps even more so today given overall geo-political uncertainty and heightened tensions between China and the US over Taiwan.
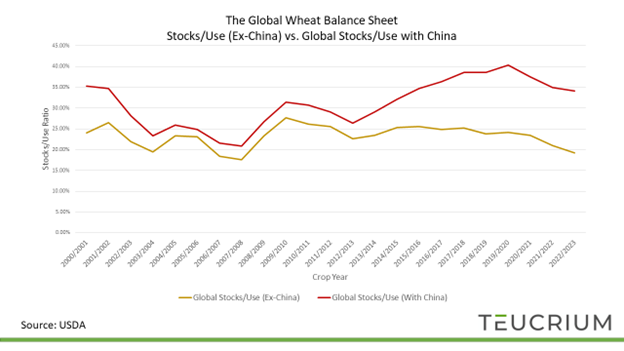
The World Ex-China
Either way, regardless of the amount, the wheat that is in China is not leaving China.With this understanding it makes sense to analyze the global wheat balance sheet excluding China.Recall from above that the global wheat stocks/use ratio (including China) is projected at 34%.Remove China from the equation and the stocks/use ratio falls to 19.2%.What’s more, the global stocks/use ex-China peaked in the ’09-’10 crop year and is now at its lowest level since ’07-’08.
Chart #5
Wheat futures prices are likely keying off the “ex-China,” figures.Note that prices are also near levels not seen since ’07-’08.
Chart #6
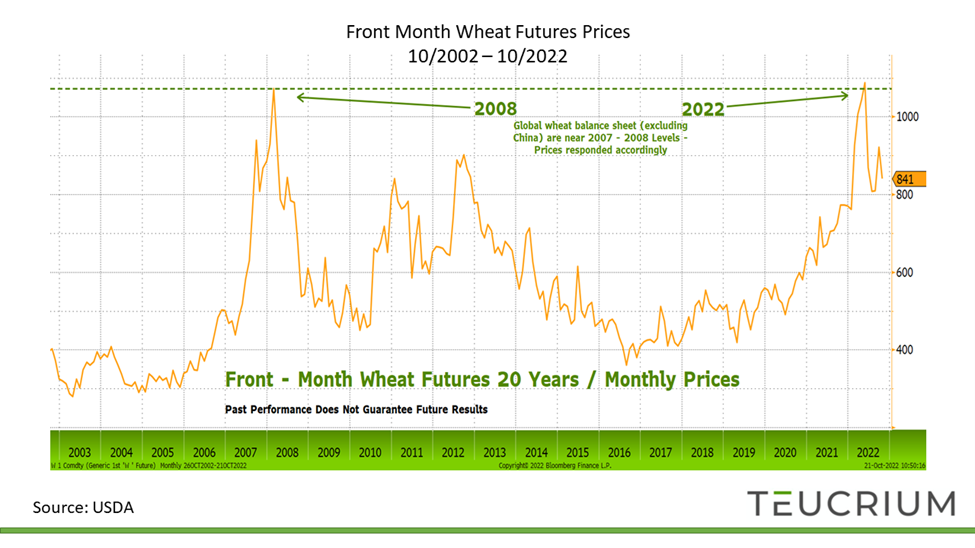
This chart is for illustrative
purposes only.Front-Month Wheat Futures 10/21/2002 -10/21/2022. Source:
Bloomberg Finance L.P.
Past performance does not guarantee future results.For this purpose, wheat commodity values are representative of the futures (generic first wheat futures contract - <W 1 Comdty>) spot continuation chart as defined by and sourced on Bloomberg:Generic contracts, such as W 1, W 2, W 3, ..., are constructed by pasting together "rolling" contracts, according to the pre-selected roll types on the commodity default page. The generic contract uses the value of a particular contract month until it "rolls" to the next month in the series. You can access a generic contract by replacing the month/year code with the number 1, i.e. W 1<CMDTY>. Replacing the month/year code with the number 1 will yield the spot contract.”
Keep An Eye on Imports
Even as the trade appears to be discounting Chinese wheat supplies, there is one number that will continue to garner the market’s attention:Chinese imports.
Chinese wheat imports have averaged approximately 5% of the world market over the past three years, a rate that is roughly double the previous three-year average of 2.27%.Continued growth in Chinese wheat imports would further strain the global wheat balance sheet.
Conclusion
While much of the focus remains on the war in Ukraine, wheat market participants are also keeping a close eye on China.The official numbers suggest that China’s wheat supply is more than adequate; yet, the recent acceleration in Chinese wheat imports suggests that Government officials believe the country needs more wheat.Perhaps Chinese wheat supplies are much lower than what is being reported.Or maybe Chinese officials are intentionally stockpiling wheat amid rising geopolitical tensions.
Regardless of the reason, it’s clear that China is not in a position to export wheat.The wheat that is in China is staying in China. Removing China’s supplies from the global balance sheet makes it clear that the global wheat balance sheet is likely much tighter than the headline number suggests.
[1] https://www.bloomberg.com/news/articles/2022-08-17/russia-wheat-flows-drag-as-war-hits-shipment-of-record-harvest
https://www.spglobal.com/commodityinsights/en/market-insights/latest-news/agriculture/080122-ukraines-wheat-exports-slump-53-on-year-to-325000-mt-in-my-2022-23
[2] Ending Stocks (also called carry-out): The amount of wheat that will be available at the end of the crop year given the estimated or actual beginning stocks, production, and usage.
[3] Stocks/Use Ratio: Ending stocks divided by total usage
[4] USDA PSD Online