Soybean Surprise
Teucrium | September 14, 2022
Weather Takes a Bite Out of Expected US Production
Jake Hanley, CMT
Managing Director, Sr. Portfolio September 14, 2022
The US soybean balance sheet is shrinking. This is bad news for consumers already grappling with inflated food prices. Still, the USDA is projecting record global soybean production this year which is weather dependent and relies heavily on South American production. If we get record production, then we might see a build in global inventories this year. If not, then expect a historically tight global balance sheet to remain supportive for prices.
US Soybean Surprise
46 million bushels of the expected US soybean supply vanished in the month of August. This according to the latest USDA WASDE report, released on September 12th.1 In the previous report, released on August 12, the USDA estimated that the US balance sheet would include 246 million bushels of soybeans at the end of the ’22-’23 crop year. That number now stands at 200 million bushels reflecting a nearly 19% reduction in one month.
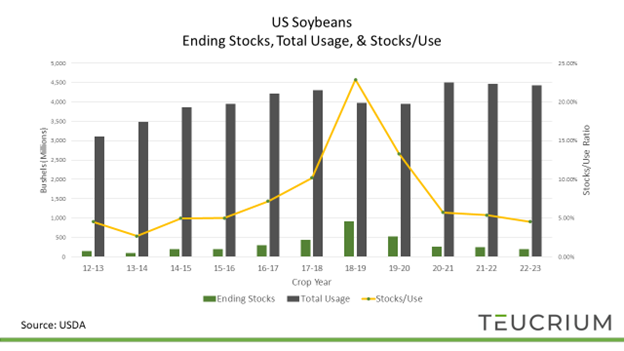
The dramatic revision surprised the market. Front-month soybean futures rose nearly 5% on the news, and for good reason. Us soybean consumption is expected to exceed production for the third consecutive year. The production is simply not keeping up with demand. As a result, the US soybean stocks/use ratio2 has dropped to near-decade lows (yellow line on chart 1 below).
Chart 1
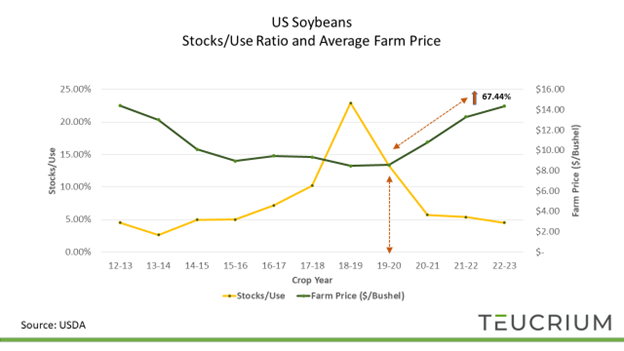
US soybean prices have responded with the average farm price3 increasing more than 67% since the ’19 – ’20 crop year. The stocks/use ratio reflects balance sheet tightness. The lower the ratio moves the more supportive it is for prices. You can see this relationship in chart 2 below.
Chart 2
Not indicative of any investment. Past Performance Does Not Guarantee Future Results.
Global Outlook
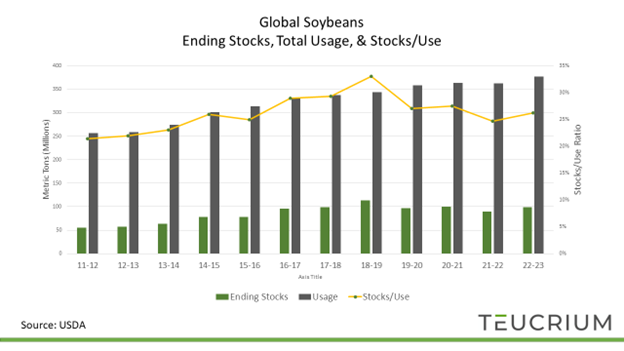
Even as the US domestic soybean balance sheet is tightening, the global balance sheet is expanding. The USDA expects global soybean inventories to grow for the second consecutive year. Yet, the forecast is predicated on record global production and an average increase in demand.4
Chart 3
Not indicative of any investment. Past Performance Does Not Guarantee Future Results.
Production, of course, is weather-dependent, and the weather has not been cooperating lately. A stubbornly persistent La Nina pattern has contributed to unfavorably hot and dry weather in key crop-producing areas. This has taken a bite out of expected global grain production for the past two years.
For example, hot/dry weather resulted in a final ’21-’22 South American soybean production that was some 1.19 billion bushels below initial estimates. Poor South American production contributed to a more than 10% drop in global ending stocks between the ’20-’21, ’21-’22 crop years.
For example, hot/dry weather resulted in a final ’21-’22 South American soybean production that was some 1.19 billion bushels below initial estimates. Poor South American production contributed to a more than 10% drop in global ending stocks between the ’20-’21, ’21-’22 crop years.
Yet, La Nina appears to be on its way out. The latest forecasts indicate neutral conditions returning as soon as February 2023.5 Broadly speaking this could be a positive sign for global crop production. Still, weather can be highly volatile and largely unpredictable.
Conclusion
The US soybean balance sheet is set to tighten for the third consecutive year. The reduction in the US balance sheet is an unwelcome development for global consumers facing historically elevated food prices. Still, the USDA is projecting record global soybean production for the ’22-’23. The trade is paying close attention to South America as farmers there are just beginning to plant their soybean crop. If the weather cooperates, we just might see record global soybean production. If not, then we might not get a build in global soybean supplies until the ’23-’24 crop year.
Either way the supply/demand situation remains historically tight. We expect prices to remain volatile. Options are available on the Teucrium funds. Please consult your financial advisor or broker for additional information.
[1] WASDE – World Agricultural Supply and Demand Estimate
[2] Stocks/Use Ratio: Ending stocks divided by total usage, whereas Ending Stocks (also called carry-out) represents the amount of a crop that will be available at the end of a crop year given the estimated or actual beginning stocks, production, and usage.
[3] Season average farm price, i.e. farmer selling price according to the USDA.
[4] The global production forecast reflects a year-over-year increase o 9%. Between 2012 and 2022 global annual usage grow by 3.97% on average.
[5] ENSO (EL Nino-Southern Oscillation) Forecasts track three conditions: La Nina, Neutral, and El Nino.