Crop Tour Spots Trouble for US Corn
Teucrium | August 29, 2022
A Bigger Hit to US Corn Supplies?
Jake Hanley, CMT
Managing Director, Sr. Portfolio August 29, 2022
Mission complete. Last week the scouts wrapped up the 30th annual Pro-Farmer crop tour. For the past three decades, Pro-Farmer has been dedicated to “…provid[ing] the industry with accurate growing season information about likely corn and soybean yields at the state and regional levels…”
Crop tour scouts pull samples directly out of the fields from the 7 largest corn and soybean producing states. The sampling provides analysts with valuable “on the ground data” that gets worked into production estimates. Following the tour, Pro-Farmer releases their official estimates. Historically, those estimates have been fairly accurate. Since 2003 Pro-Farmer’s yield estimates have, on average, been within a margin of 1.3% +/- vs. the USDA final numbers for corn and a margin of 2.2% +/- for soybeans.[1]
The historical accuracy of the Pro-Farmer estimates is not lost on grain traders. In fact, US corn prices advanced last week as crop tour data showed less than ideal corn conditions in many key production areas.
Chart 1
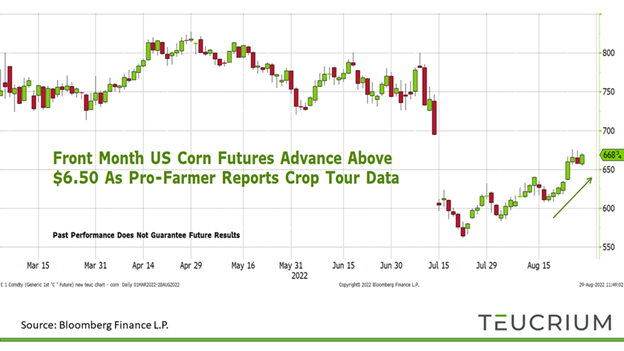
This chart is for illustrative purposes only. Front-Month Corn Futures 03/01/2021 -08/26/2022. Source: Bloomberg Finance L.P. Past performance does not guarantee future results. For this purpose, corn commodity values are representative of the futures (generic first corn futures contract - <C 1 Comdty>) spot continuation chart as defined by and sourced on Bloomberg: Generic contracts, such as C 1, C 2, C 3, ..., are constructed by pasting together "rolling" contracts, according to the pre-selected roll types on the commodity default page. The generic contract uses the value of a particular contract month until it "rolls" to the next month in the series. You can access a generic contract by replacing the month/year code with the number 1, i.e. C 1<CMDTY>. Replacing the month/year code with the number 1 will yield the spot contract.”
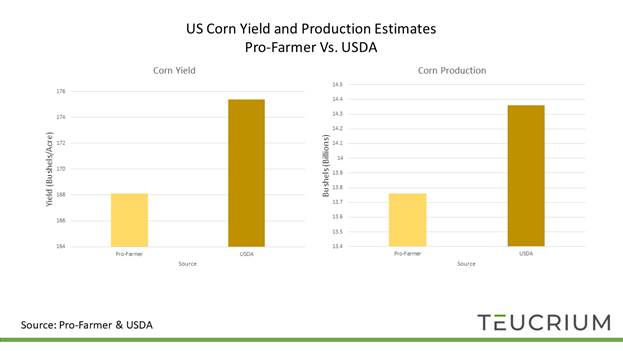
Pro-Farmer’s US corn yield estimate is 7 bushels per acre lower than the USDA’s estimate.[2] What’s more, Pro-Farmer is estimating total US corn production at 13.759 billion bushels, 600 million bushels below the USDA’s estimate.[3]
Chart 2
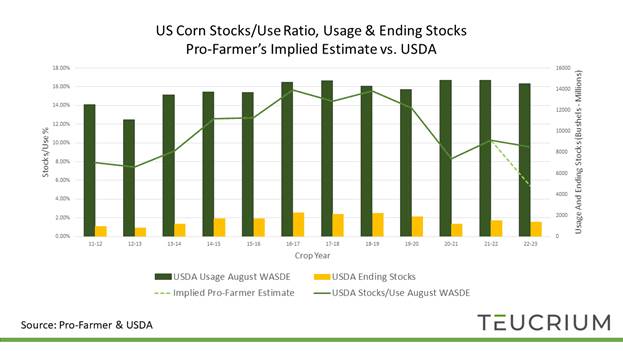
Plugging in the Pro-Farmer corn production estimates on the USDA’s balance sheet while making no other adjustments suggests a near-record low stocks/use[4] ratio of 5.43% for US corn (dotted line in chart 3 below). If the Pro-Farmer estimates are realized, then it is likely that usage will be revised lower. This is a natural market function. The expectation for lower supplies leads to higher prices which negatively impacts demand as some are “priced out” of the market.
Corn prices are already at historically high levels and demand remains robust. Corn is food after all. Humans need to eat, and so do our animals. Note the slight year-over-year reduction in US corn usage reflected in the bars on the chart below.
Chart 3
Watch the WASDE
The USDA always has the last word. While the USDA’s “final”[5] production numbers are released in the January, the trade will watch very closely the next two WASDE releases for downward revisions to US corn yields.
The next WASDE Report is scheduled for release at 12:00 p.m. ET on Monday September 12th.
The October WASDE is scheduled for release at 12:00 p.m. ET on Wednesday the 12th.
Please follow along with us to stay up to date on market developments. You can follow us on Twitter @Teucrium ETFs, and subscribe to our newsletter - www.teucrium.com
[1] https://nesbittburns.bmo.com/don.mcgugan/page_88251
[2] USDA World Agricultural Supply and Demand Estimate (WASDE) report August 2022.
[3] ibid
[4] Stocks/Use Ratio: Ending stocks divided by total usage, whereas Ending Stocks (also called carry-out) represents the amount of a crop that will be available at the end of a crop year given the estimated or actual beginning stocks, production, and usage.
[5] Even final numbers are subject to revision.