A Rubber Chicken Market
Teucrium | July 7, 2022
Wheat Prices Remain Volatile
Jake Hanley, CMT
Managing Director, Sr. Portfolio Strategist July 7, 2022
Have you ever gnawed on grilled chicken that tastes like rubber? It’s a sign that the chicken is overdone.
Front-month wheat futures prices are trading 42% below their highs and trading back near levels last seen prior to Russia’s invasion of Ukraine. Wheat selling picked up pace in the middle of June and accelerated through the end of the month. Like a piece of rubber chicken, there are signs that the recent bout of selling might be overdone.
Getting Technical
Chart watchers often reference an indicator known as the Relative Strength Index (RSI). RSI measures the magnitude of a security’s price movements over a specified period (typically the previous 14 trading days). RSI is displayed on a chart as a line graph that oscillates between two boundaries, 0 and 100. As the securities price increases, RSI increases as well. Alternately, when the security price declines, RSI follows suit and moves lower. A reading above 70 is typically seen as a sign that the underlying security may be overbought. Likewise, when RSI crosses below 30 it is a signal that the underlying security may be oversold. [1]
As you can see on the chart below, the RSI on front-month wheat futures spiked above 70 in early March coinciding with the invasion of Ukraine. That was an indication that the buying in wheat futures was, perhaps, overdone. RSI has since retreated all the way back below 30. This too is a signal that the selling might also be overdone.
Present market conditions offer a good reminder that volatility works both ways. Both buyers and sellers often become overzealous which can lead to significant price swings.
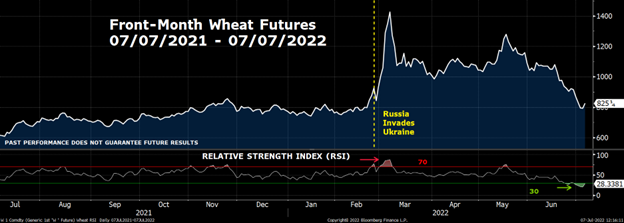
This chart is for illustrative purposes only. Front-Month Wheat Futures 07/07/2021 -07/07/2022. Source: Bloomberg Finance L.P. Pas performance does not guarantee future results. For this purpose, wheat commodity values are representative of the futures (generic first wheat futures contract - <W 1 Comdty>) spot continuation chart as defined by and sourced on Bloomberg: Generic contracts, such as W 1, W 2, W 3, ..., are constructed by pasting together "rolling" contracts, according to the pre-selected roll types on the commodity default page. The generic contract uses the value of a particular contract month until it "rolls" to the next month in the series. You can access a generic contract by replacing the month/year code with the number 1, i.e. W 1<CMDTY>. Replacing the month/year code with the number 1 will yield the spot contract.”
Fundamentally Speaking
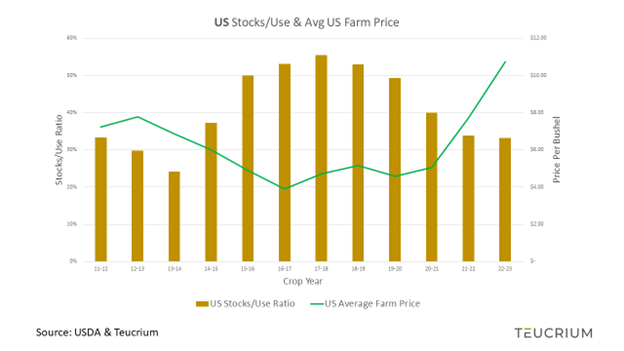
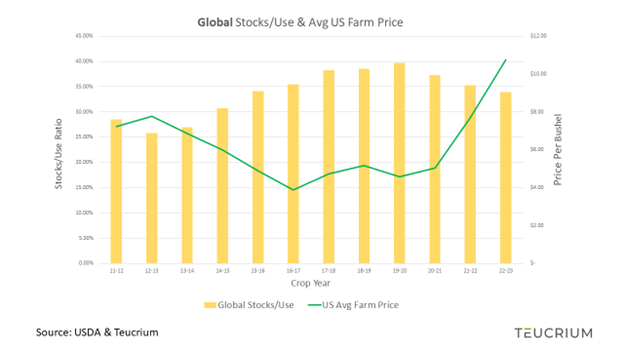
US wheat supplies are expected to shrink relative to demand for the 5th year in a row.[2] Global wheat supplies are also expected to contract for the 3rd year in a row. Tighter supplies in the face of strong demand is fundamentally bullish.
That said, both the US and global wheat balance sheets are in better shape than they were back in the 2012 – 2013 crop year. Yet, the USDA estimates that the average price for a bushel of wheat in the US is $10.75. Compare that to 2012-2013 when the price was $7.77. Considering that there is more wheat relative to demand today than there was back in ’12-’13 one might reasonably expect prices to be lower than they were in ’12-’13. And yet the USDA estimates prices to be nearly $3 per bushel higher!
This discrepancy can perhaps be most immediately explained by the war in Ukraine. Note that Ukrainian wheat supplies are included in the global supply estimates. Those supplies are expected to grow by another 7% this year after nearly quadrupling last year.
At the same time, the USDA is estimating a near 50% drop in Ukrainian wheat exports due to the Black Sea blockade. On the one hand, a build in supplies is fundamentally bearish. On the other hand, the blockade has made much of the Ukrainian wheat supply inaccessible.
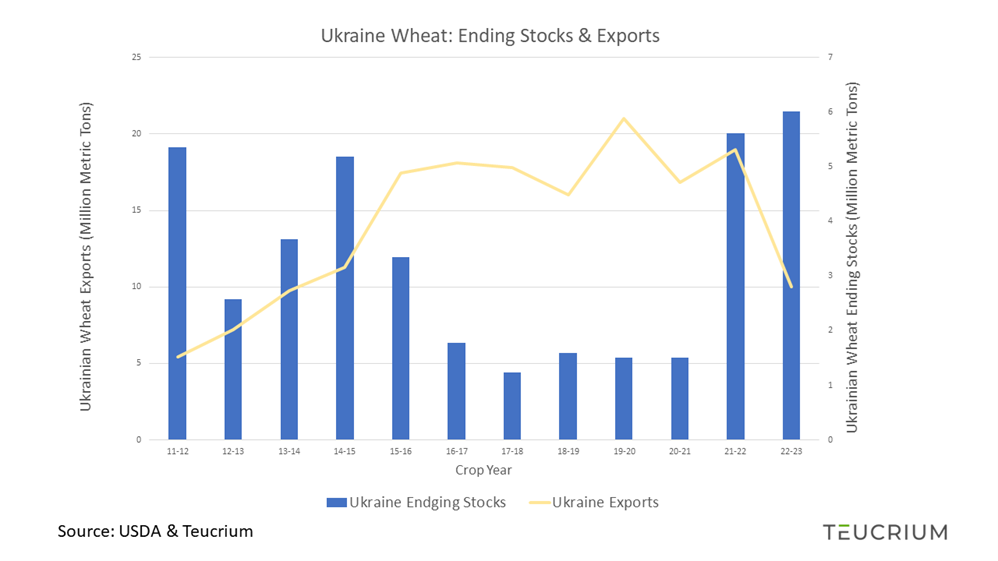
The chart above shows a dramatic build in Ukraine’s wheat supply which is expected to hit a 10 – year high. At the same time exports have plummeted.
The volatility we’ve seen over the past few months has largely stemmed from the uncertainty surrounding Ukrainian wheat availability.
Still, even with a near 50% drop in Ukrainian wheat exports, the USDA is projecting total global exports to increase by roughly 3% this year. Note, however, that the increase in global wheat exports includes an 18% increase in Russian exports. Russia is expected to account for 1/5th of global wheat exports in ’22-’23. That alone may lead to continued uncertainty in the market:
Can the world rely on Russia to deliver?
Will Russia look to press their advantage and weaponize wheat, i.e. use wheat as a bargaining chip with the West?
Conclusion
The war in Ukraine has upended international wheat markets, and not much has changed. Wheat is still trading in a wartime market. Remember volatility can go both ways. Prices can come down just as fast (if not faster) than they rise.
During periods of heightened uncertainty prices may get ahead of themselves. In the past few months, we’ve seen signs that buyers “overbought,” on the way up, and we’re now seeing signs that sellers may have “oversold,” on the way down. In a rubber chicken market, price moves can be overdone in either direction.
Options are available on the Teucrium Wheat Fund. Please speak with your financial advisor or broker for additional information.
Please be sure to follow us on Twitter @TeucriumETFs and subscribe to our newsletter at Teucrium.com
Options are available on the Teucrium Wheat Fund. Please speak with your financial advisor or broker for additional information.
[1] Learn more about RSI here: https://www.investopedia.com/terms/r/rsi.asp
[2] Supply relative to demand can be expressed using the “Stocks/Use Ratio.” Stocks/Use Ratio: ending stocks divided by total usage (i.e. consumption). Ending Stocks (also called carry-out): The amount of wheat that will be available at the end of the crop year give the estimated or actual beginning stocks, production, and usage.