For Such a Market as This
Teucrium | June 15, 2022
Why We Are Here
Jake Hanley, CMT
Managing Director, Sr. Portfolio Strategist June 15, 2022
Ask our founder and CEO Sal Gilbertie why he started Teucrium, and he will tell you, “…for such a market as this!” We launched our first fund in 2010, and fast forward to 2022 and our ETFs have never been more popular.
Recently, most investors with whom we speak repeatedly point to one catalyst that brought them to consider our funds: Inflation.
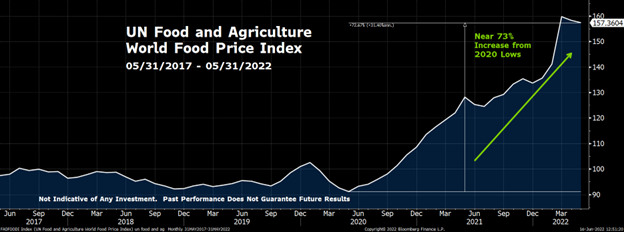
UN Food and Agriculture World Food Price Index. Source: Bloomberg Finance L.P. generated on 06/16/2022. This chart is for illustrative purposes only and is not indicative of any investment. Past performance does not guarantee future results.
Since bottoming in May of 2020 world food prices are up nearly 73%
Food prices reflect the reality of global supply and demand dynamics. Long-time readers will recall that the roots of today’s global food inflation stretch back to the 2019 – 2020 crop year. That year the world consumed more corn and soybeans combined than were produced. The following year the world consumed more wheat than was produced. As a result, global inventories were drawn down and farmers have been challenged by both weather and war as they attempt to rebuild stocks.
Spotting Opportunity
The Teucrium Agricultural Fund Index is up more than 114% over two years
.png)
Teucrium Agricultural Fund Benchmark Index. Source: Bloomberg Finance L.P. Generated on 06/15/2022. This chart is for illustrative purposes only and is not indicative of any investment. Past performance does note guarantee future results.
Two years ago, we would not have guessed that our Agricultural Fund Index would be up more than 114%.[1] Still, the fundamental imbalance between supply and demand suggested that prices would likely be heading higher. In our 2020 Outlook published in December 2019, we wrote: “The fundamentals are promising…Decreasing supply in the face of rising demand eventually, we believe, will lead to higher grain prices.”[2] The law of supply and demand is Econ 101, not rocket science. We were not going out on a limb saying that lower supply in the face of rising demand should be supportive of prices. Yet, to spot opportunities, like the one afforded to grain investors over the last couple of years, you must be paying attention. (You can subscribe to our newsletter here www.teucrium.com)
Grains in Your Portfolio
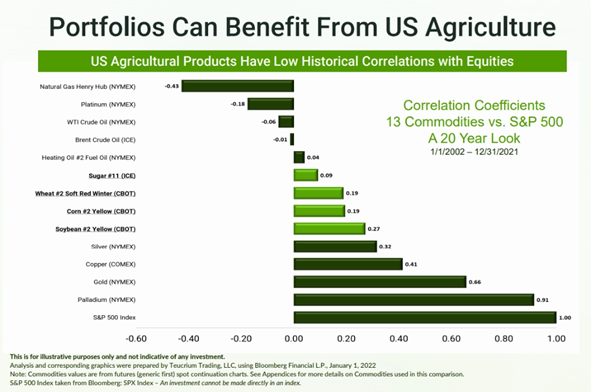
While commodity investors have had a good run over the past 24 months, traditional stock and bond investors are feeling the pain. Stocks and bonds have trended lower. Someone with the typical 60/40 stock-to-bond allocation has likely lost approximately 17% this year.[3] The relative outperformance of the Teucrium Agricultural Fund Index should not come as a surprise given that corn, wheat, soybeans, and sugar all historically have low correlations to stocks.
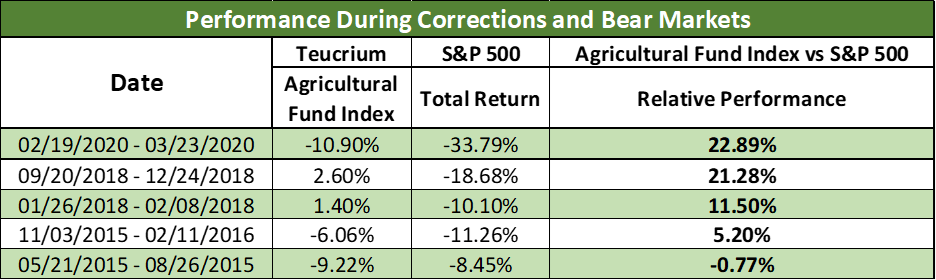
Additionally, the Teucrium Agricultural Fund Index has outperformed the S&P 500 Total Return Index in 4 out of the last 5 stock market corrections of 10% or more. Our data does not yet include the most recent equity downturn which began in January 2022. We will update our data at the end of the current S&P 500 bear market. Notably, the Teucrium Agricultural Fund Index has thus far outperformed the S&P 500 Total Return Index in the current downturn.
Since the stock market peak on January 4, 2022 the S&P 500 Total Return Index has fallen 21.52%, whereas the Teucrium Agricultural Fund Index has gained 25.75%. In other words, the Teucrium Agricultural Fund Index has outperformed the S&P 500 Total Return Index by approximately 47% in the current stock market downturn.
Looking Ahead
Grain prices have had an impressive run over the past 24 months. As stated above, higher prices, by and large, reflect the uncertainty surrounding supply/demand imbalances.
However, wheat is trading in a wartime market, and we believe that current prices reflect a significant risk premium over and above ordinary wheat supply/demand fundamentals.
Corn prices also likely reflect uncertainty connected to the War in Ukraine, yet the trade’s focus will largely remain fixed on US weather for the summer growing season.
US weather will likely remain the primary focus for the soybean trade as well over the summer.
Bulls will point out that there is little room for error given tight global balance sheets. Unfavorable weather could lead to lower-than-expected US crop production. There is the potential for prolonged War in Ukraine and for a further deterioration of relations between Russia and the West. Input costs, i.e. energy, fertilizer, etc. will likely remain elevated providing further long-term support for grain prices.
Bears will point to seasonal price pressure, (see our recent commentary Turning Point – A Top for Grain Prices?) and the fact that farmers across the globe are likely to continue their attempt to plant as much acreage as possible. The USDA is forecasting record global soybean production, and a near-record global corn and wheat production in the ’22-’23 crop year.[4] Production is largely weather dependent, but after two consecutive years of unfavorable weather, the base case is that weather will cooperate in ’22-’23. Furthermore, while the Russian invasion of Ukraine has disrupted supply chains, wheat inventories remain at reasonable levels. Consider that the expected global stocks/use[5] ratio for wheat in ’22-’23 is 33.95%. Compare that to the 5-year average of 37.82%, and the 10-year low of 25.81% reached in the ’12-’13 crop year and it’s clear that there is plenty of wheat in the world. It’s only a matter of getting it to market.
Conclusion
Current market conditions have made evident that prices of commodities in general, and agricultural commodities in particular, can zig when other assets zag. Low historical correlations and a history of outperformance during equity downturns, all contribute to the investment thesis of incorporating agriculture in a portfolio for the potential diversification benefits.
Additionally, commodities may provide shelter from the “inflation storm.” Agricultural offers investors an alternative to stocks and bonds – assets that have not held up as well during this latest bout with inflation.
To all investors, past, and present, thank you for your interest in our funds. These funds were built with you in mind, for such a market as this.
Please note that options are available on CORN, WEAT, SOYB, CANE, and TAGS. Please consult your broker for more information.
[1] The Teucrium Agricultural Fund (ticker: TAGS) is benchmarked to the Teucrium Agricultural Fund Benchmark Index. The index represents an equal weighting to our four individual commodity funds, the Teucrium Corn Fund (CORN), the Teucrium Wheat Fund (WEAT), the Teucrium Soybean Fund (SOYB), and the Teucrium Sugar Fund (CANE). Performance data provided by Bloomberg Finance L.P. using <TTAGS Index Go> as of 06/15/2022.
[2] You can read our 2020 Outlook here: http://www.teucrium.com/news-insights/146
[3] Data Source: Bloomberg Finance L.P. 60% SPY and 40% AGG YTD percentage performance as of 06/13/2022
[4] Corn production expected to be 2nd highest ever globally, slightly trailing last crop year’s record. Wheat production is expected to be the 3rd highest ever and still only 1% lower than last year’s record.
[5] Stocks/Use Ratio: Ending stocks (i.e. the amount the crop available at the end of the crop year, given the estimated or actual beginning stocks, production, and usage) divided by total usage.