Investing In Agriculture
Teucrium | May 5, 2022
A New Strategy from Teucrium
Jake Hanley, CMT, Managing Director / Sr. Portfolio Strategist
Introducing:
The Teucrium Agricultural Strategy No K-1 ETF (ticker: TILL)
Food Inflation – Think Agriculture
During periods of high inflation, investors often turn to commodities. Commodities are the "ingredients," in the things we consume every day. What we typically think of as "food" commodities, are pervasive across the global economy. Corn, wheat, soybeans, and sugar are used as feed animals, fuel for transportation, and sweetener for food.
These commodities play an essential role in our daily lives. As such, their prices are largely inelastic. That is, when prices go up consumer demand remains about the same. This is important because supply and demand dynamics drive commodity prices. Global supplies have been shrinking relative to demand over the past two years. This has been supportive for prices. The grains (corn, wheat, and soybeans) are trading near 10-year highs, and sugar is trading near its highest level in 5 years.
The current price rally, while significant, is not abnormal. In fact, we've identified a 3-stage cycle that has played out 3 times in the past 15 years.
Food Prices: 3-Stage Cycle
Stage 1: Prices trend near the cost of production
Governments across the globe subsidize food production. This results in extended periods where prices trade at or near their cost of production. At the same time, global demand continues to trend higher amid population growth and rising incomes.
Stage 2: Production issues lead to supply concerns, prices spike higher
Historically, there comes a point where production fails to keep pace with demand. When this happens, supply concerns emerge, and prices spike. For example, we've seen corn prices jump from around $3.50 per bushel to over $7 per bushel three times since 2007 (see chart below).
Stage 3: Production increase, prices turn lower
Higher prices incentivize increased production and supply chain investment. Eventually prices head back toward their cost of production as inventories are replenished and become more accessible.
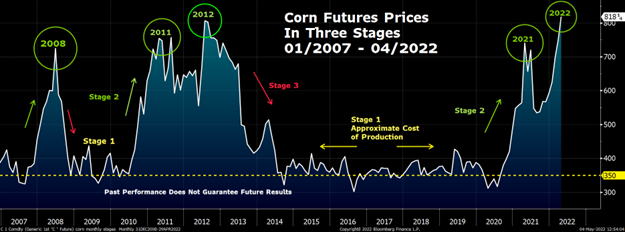
This chart is for illustrative purposes only and is not indicative of any investment. Past performance does not guarantee future results. US corn commodity values are representative of the futures (generic first corn futures contract - <C 1 Comdty>) spot continuation chart as defined by and sourced on Bloomberg: Generic contracts, such as C 1, C 2, C 3, ..., are constructed by pasting together "rolling" contracts, according to the pre-selected roll types on the commodity default page. The generic contract uses the value of a particular contract month until it "rolls" to the next month in the series. You can access a generic contract by replacing the month/year code with the number 1, i.e. C 1<CMDTY>. Replacing the month/year code with the number 1 will yield the spot contract.”
Of course, past performance does not guarantee future results. Yet, the supply/demand fundamentals underpinning this cycle suggest that history is likely to rhyme, if not repeat.
Investors looking for futures price exposure to these markets may consider our newest fund:
The Teucrium Agricultural Strategy No K-1 ETF (ticker: TILL)
TILL provides investors long only futures price exposure to corn, wheat, soybeans, and sugar. As the name indicates, TILL does not issue a K-1 tax form. This is important given that some brokerage platforms do not allow investors to own K-1 issuing funds. Registered under the Investment Company Act of 1940, TILL investors can expect to receive the familiar form 1099 at tax time.
TILL will hold one futures contract in each of the four (corn, wheat, soybean and sugar) markets excluding the front-month (aka spot) contract. The portfolio managers follow a proprietary strategy for contract selection designed to help mitigate the potential negative impacts of contango. The fund is managed to maintain an approximate equal weighting between the holdings at 25% each.
TILL is an actively managed strategy and is not designed to track an index. Investors looking for a passively managed strategy may consider the Teucrium Agricultural Fund, ticker: TAGS. Please note that TAGS issues a K-1.
Agricultural in Your Portfolio
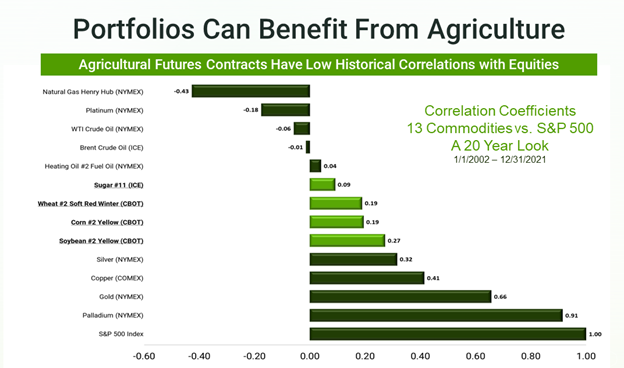
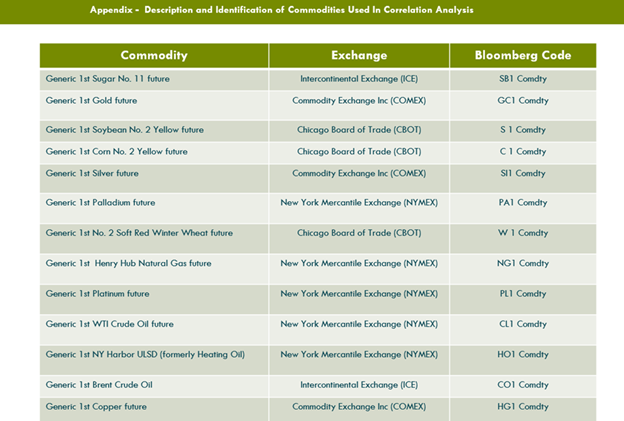
Note: Commodities values are from futures (generic first) spot continuation charts. See Appendices for more details on Commodities used in this comparison.
S&P 500 Index taken from Bloomberg: SPX Index – An investment cannot be made directly in an index.
Investors are increasingly discovering agriculture’s role in a portfolio. Historically, corn, wheat, soybeans, and sugar, all have low correlations to stocks. As such, agriculture prices may zig, when stock prices zag. Typically, agricultural prices lag stocks during equity bull markets. Yet, low correlations also suggest that agricultural prices may outperform stocks on the downside.
For example, corn, wheat, soybeans, and sugar futures all outperformed the S&P 500 over the past two years (04/30/2020 - 04/29/2022).
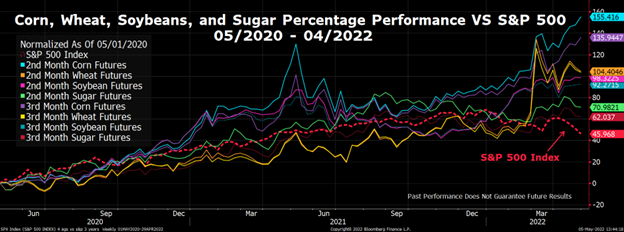
This chart is for illustrative purposes only and is not indicative of any investment. Past performance does not guarantee future results. Futures prices for corn, wheat, soybeans, and sugar referencing 2nd and 3rd to expire contracts. See footnotes for further details.[1]
Investors with whom we speak, repeatedly point to incorporating agriculture as part of a diversified commodity sleeve in a portfolio. The graphic below illustrates a hypothetical strategic allocation, showing just how agriculture may fit into the investment pie.
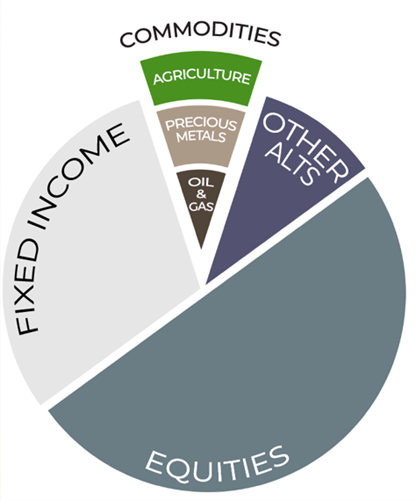
Hypothetical Investment Portfolio
Expect Volatility
We expect agricultural markets to remain volatile. Market participants will be keeping a close eye on the war in Ukraine, and US weather over the next few months. Increased geopolitical tensions and deteriorating weather could provide additional price support for agricultural prices.
Yet, given that these commodities are already trading at relatively high levels there is ample room for prices to head lower. Be sure to follow along with us as we monitor market developments. Please subscribe to our newsletter at www.teucrium.com, and follow us on Twitter @TeucriumETFs.
[1] US corn commodity values are representative of the futures (generic second and third corn futures contract - <C 2 and C 3 Comdty>) continuation chart as defined by and sourced on Bloomberg: Generic contracts, such as C 1, C 2, C 3, ..., are constructed by pasting together "rolling" contracts, according to the pre-selected roll types on the commodity default page.
Wheat commodity values are representative of the futures (generic second and third Chicago Wheat futures contract - <W 2 and W 3 Comdty>) continuation chart as defined by and sourced on Bloomberg: Generic contracts, such as W 1, W 2, W 3, ..., are constructed by pasting together "rolling" contracts, according to the pre-selected roll types on the commodity default page.
Soybean commodity values are representative of the futures (generic second and third soybean futures contract - <S 2 and S 3 Comdty>) continuation chart as defined by and sourced on Bloomberg: Generic contracts, such as S 1, S 2, S 3, ..., are constructed by pasting together "rolling" contracts, according to the pre-selected roll types on the commodity default page.
Sugar commodity values are representative of the futures (generic second and third ICE #11 futures contract - <SB 2 and SB 3 Comdty>) continuation chart as defined by and sourced on Bloomberg: Generic contracts, such as SB 1, SB 2, SB 3, ..., are constructed by pasting together "rolling" contracts, according to the pre-selected roll types on the commodity default page.
The generic contract uses the value of a particular contract month until it "rolls" to the next month in the series. You can access a generic contract by replacing the month/year code with the number 1, i.e. C 1<CMDTY>. Replacing the month/year code with the number 1 will yield the spot contract.”