This Year is Critical
Global Importance of US Corn and Beans
Teucrium | March 23, 2022
Jake Hanley, Managing Director / Sr. Portfolio Strategist March 23, 2022
Global food prices are at record highs. Global corn and soybean supplies are at 5-year lows relative to demand. The war in Ukraine is adding stress to supply chains that are still reeling from the effects of COVID-19.
In a world plagued with uncertainty, one thing is becoming increasingly evident. High food prices are likely to stick around for an extended period of time.
Against this backdrop, American farmers are gearing up to plant corn and soybeans. One cannot overstate the global importance of the combined US crop this year.
South American Woes
South America lost approximately 30 million metric tons of expected soybean production to drought this year. This is a big deal given that Brazil, Argentina, and Paraguay account for 55% of global soybean exports.
Dry conditions pose a risk to Brazil's second crop corn as well. What's more, high fertilizer prices and limited availability may lead to reduced application. Lower yields are likely if the Brazilian corn crop does not get the fertilizer it needs.
War
Furthermore, corn market participants are eying additional risks in Ukraine. As war rages, analysts are worried that as much as 50% of expected corn production could be lost. This would have global ramifications as Ukraine was predicted to account for 16% of global corn exports in the coming crop year.
U.S. Plantings
The USDA releases the prospective plantings report on March 31st. Last year US farmers planted a record 180.6 million combined corn and soybean acres. We expect farmers will plant up to one million additional acres of corn and soybeans combined this Spring. In February we wrote that soybeans were likely to "buy acres," from corn. Yet, the war in Ukraine has changed the math. The key price ratio between November soybeans and December corn has declined to 2.24. Generally speaking, a ratio above 2.35 favors planting soybeans, whereas a ratio below 2.35 favors corn. On February 15th that ratio was 2.42. We still expect a year-over-year increase in soybean acres. Yet, in total, there will likely be more acres dedicated to corn.
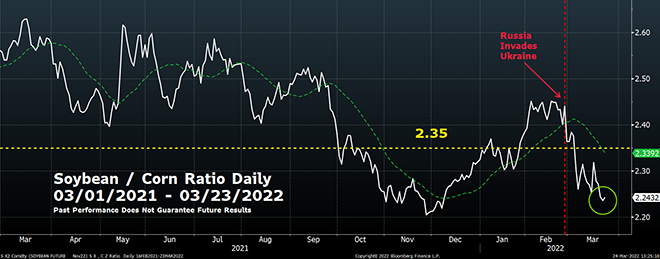
Source: Bloomberg Finance L.P. and Teucrium Created 03/23/2022. This is for illustrative purposes only and not indicative of any investment. Past performance does not guarantee future results. For this purpose, soybean commodity values are representative of the futures (November 2022 soybean futures contract - <SX2 Comdty>), corn commodity values are representative of the futures (December 2022 corn futures contract - <CZ2 Comdty>). The vertical axis shows the value of the ratio: SX2 Comdty / CZ2 Comdty.
US Weather
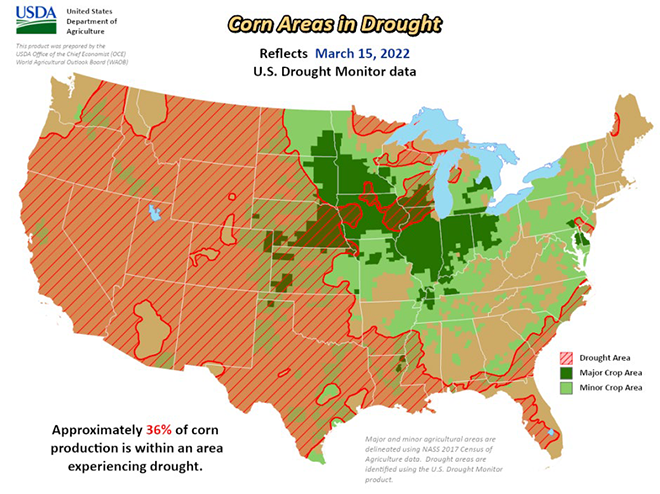
Assuming trendline yields, the US will produce a record crop. Yet, the weather will need to cooperate. As of March 15th, approximately 36% of US corn farmland was experiencing drought.
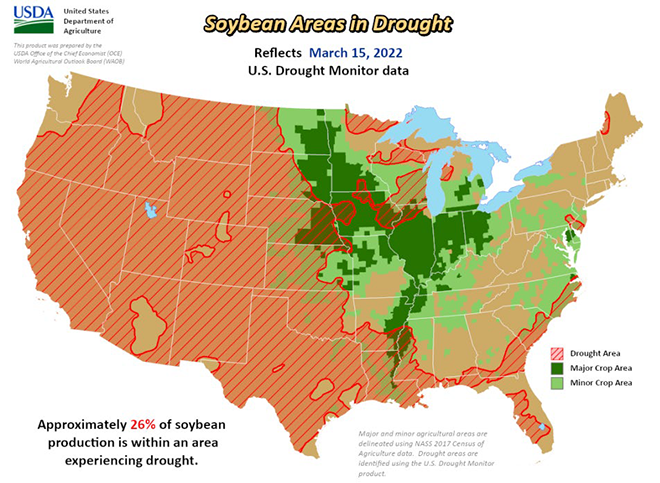
Similarly, 26% of soybean farmland was experiencing drought.
What's more NOAA is forecasting a hot and dry growing season for the Western corn belt. If conditions deteriorate, we will expect to see US yield estimates revised lower.
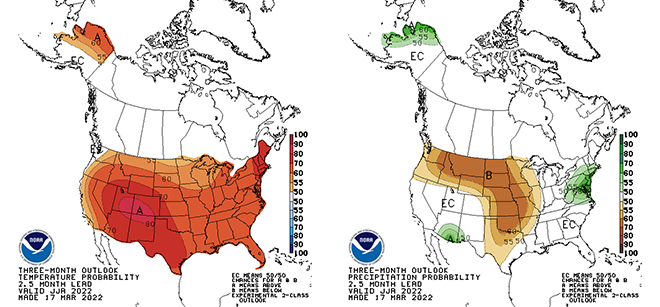
Unfavorable weather and lower US production expectations would be supportive of prices in the near term.
Still, even a record US crop will not fully alleviate global balance sheet stress. As we wrote in our 2022 Grain Outlook, it takes time to rebuild grain supplies for the simple reason that it takes time to grow food.
Global Impacts
We believe it will take another growing season to fully ease balance sheet tensions. That puts us out to the 2023 US harvest. Prices of course are forward-looking. By this time next year prices may already be heading back toward the cost of production.
Recall our commentary on the Golden Grain Cycle available here. Grain prices tend to trade at or near their production costs for an extended period (Stage 1). Historically when there is a supply disruption, prices spike (Stage 2). Higher prices incentivize farmers to plant more. Increased plantings lead to higher production and increased supply (Stage 3). Eventually, prices return to trade at or near production costs, and the cycle is complete.
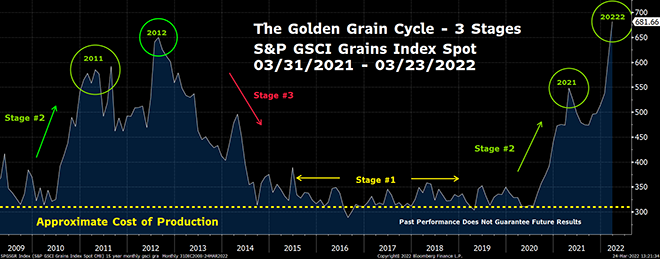
The vertical axis represents S&P GSCI Grains Index values.[1] Source: Bloomberg Finance L.P. and Teucrium Created 03/23/2022. Past performance does not guarantee future results. This chart is for illustrative purposes only and not indicative of any investment in a Teucrium Fund.
We believe markets are entering Stage 3, and we will revert back to Stage 1 somewhere around the middle of 2023. The speed at which prices move back toward production costs is unknown.
Volatility Warning
Prices can fall as fast as they rise, if not faster. Teucrium ETFs invest in futures contracts. Futures generally are volatile and may not be suitable for all investors. Please read the prospectus before investing.
Options are available on Teucrium ETFs. Please consult your Financial Advisor, or Broker for more information.
[1]For more information on the S&P GSCI Grains Index please visit: https://www.spglobal.com/spdji/en/indices/commodities/sp-gsci-grains/#overview