The Potential for Fewer US Corn Acres Could Be Supportive for Prices
Teucrium | February 15, 2022
Food inflation concerns will likely persist so long as supply and demand imbalances in major gain markets remain intact. Global corn and soybean supplies are at 6-year lows and prices are both now at 9-year highs.[1] High prices are an incentive for farmers to optimize plantings as they look to capture higher revenues when selling their crops.
Corn and soybeans are grown on the same acres. A farmer will typically rotate between corn and soybeans; planting corn for one or more consecutive years and then planting soybeans for a year in order to promote soil health. Corn takes nitrogen out of the soil and soybeans put nitrogen back into the soil.
Given that corn and soybeans are grown on the same acres, a farmer must determine which crop to plant each year. Of course, farmers with multiple fields may plant corn on one and soybeans on the other. Yet, the question remains, should the farmer equally weight the number of acres of corn and soybeans or overweight one versus the other.
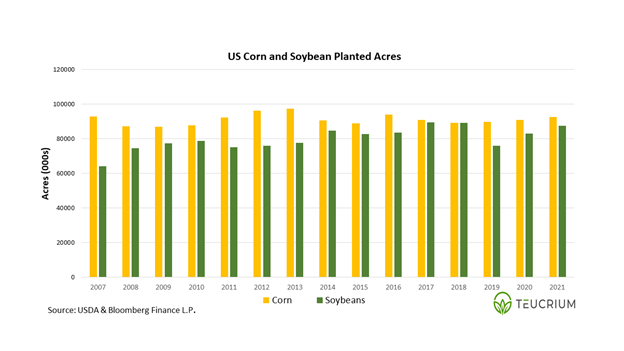
Current prices suggest that US farmers might plant more soybeans than corn in 2022. If this were to come to fruition, it would only be the second time in recorded history that American farmers plant more soybeans than corn. What’s more, it would come at a time when the corn market is hungry for more bushels.
A Tight Situation
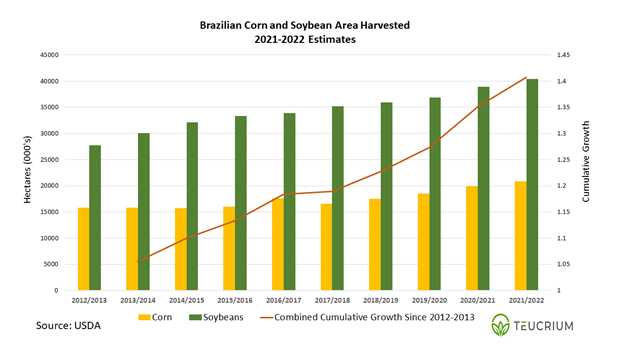
Global grain demand is robust. Higher prices are the market’s way of incentivizing farmers to produce more. Farmers around the globe have been planting more acres in response. Take Brazil for example. According to USDA estimates, combined corn and soybean acres harvested have jumped more than 10% in the past two years and 40% in the last 10 years!
Total production is the product of the acres harvested (x) yield. Crop yields are largely dependent on weather. And the weather has not been cooperating.
South American Soybean Production Takes a Big Hit
The La Nina climate pattern is causing significant production issues in South America. This is the second year in a row that we’ve seen a La Nina pattern take hold. A La Nina typically results in hot and dry conditions in key growing areas of South America. The last two years have proved no exception.
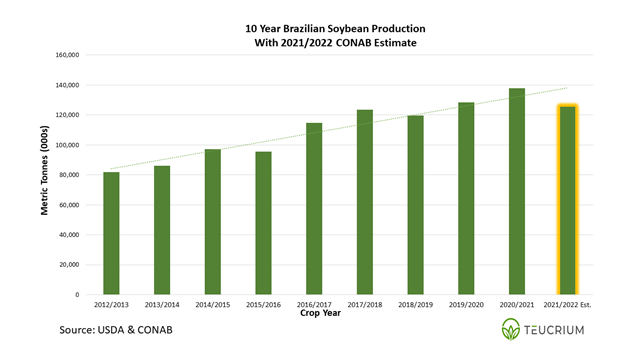
Argentina, Brazil, and Paraguay have all lost millions of tonnes of expected production. The full extent of the damage to this year’s soybean crop is only beginning to come into focus. Brazil’s food agency, CONAB, is estimating total Brazilian soybean production of 125.5 million metric tons (mmt). That is 8.5 mmt below the current USDA estimate of 134 mmt. For context, 8.5 mmt is the equivalent of approximately 312 million bushels. Last year’s entire US soybean carry-out was only 257 million bushels. Simply put, the loss there has been a significant loss of potential soybean production from South America this year.
Corn Still Has a Chance
While the damage done to the South American soybean crop is irreparable at this point, there is still a chance for the corn crop. There are two corn harvests per year in Brazil. The second corn harvest, known as the safrina crop is the larger of the two.[2] Note that even after accounting for the poor growing conditions for the first crop corn, the USDA is projecting a record Brazilian corn crop of 114 mmt. This would easily surpass the prior record of 102 mmt and represents a 31% increase compared to last year’s production.
Disappointing South American soybean production, and the potential for a record corn crop, lends further support to the idea that US farmers are likely to plant more soybeans this year.
Soybeans May “Buy” US Acres
Prices alone are presenting US farmers with a meaningful economic incentive to plant additional soybean acres at the expense of corn acres. Farmer profitability depends in part on the price of the crop. The higher soybean prices move relative to corn the more profitable it may be to plant soybeans. A key indicator is the price ratio of the November soybean futures contract to the December corn futures contract. Generally speaking, a ratio above 2.35 favors planting soybeans, whereas a ratio is below 2.35 is seen as favoring corn. Currently, the ratio is 2.4281.
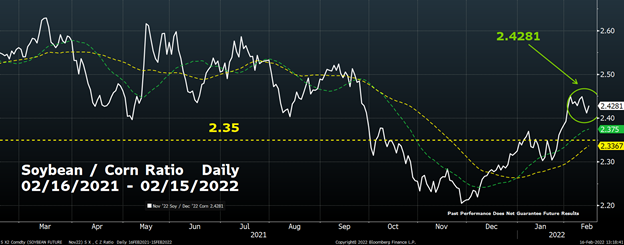
>Source: Bloomberg Finance L.P. and Teucrium Created 02/15/2022. This is for illustrative purposes only and not indicative of any investment. Past performance does not guarantee future results. For this purpose, soybean commodity values are representative of the futures (November 2022 soybean futures contract - <SX2 Comdty>), corn commodity values are representative of the futures (December 2022 corn futures contract - <CZ2 Comdty>). The vertical access on the chart shows the value of the ratio: SX2 Comdty / CZ2 Comdty.
Production costs are another component of profitability. Here too we see the math may be favoring soybean farmers. Fertilizer prices have surged over the past year (we wrote about this last fall https://www.teucrium.com/news-insights/318). Corn requires more fertilizer than soybeans.
Last year US farmers planted 93.4 million acres of corn and 87.2 million acres of soybeans. Given today’s prices (02/15/2022), and the estimated higher production costs for corn, it would make sense to see corn lose acres to soybeans this year.
The USDA is projecting record total corn usage for the ’21-’22 crop year. Fewer corn acres planted for the ’22-’23 crop year will likely keep the trade on edge as we move through the growing season. With prices at 9-year highs and the domestic stocks/use ratio already at 9-year lows (10%), the market is clearly hungry for more corn. Given present conditions, it may take some time before that hunger is satisfied.
Higher For Longer
As we wrote in our 2022 Outlook, with only one US harvest per year, it takes time to rebuild grain supplies. As it stands today, it appears to us that prices are likely to remain relatively high for an extended period of time. That is, at least until production expectations in the Northern Hemisphere become clearer as we near the harvest.
Stay on top of grain market developments. Follow us on Twitter @TeucriumETFs, and subscribe to our Newsletter at Teucrium.com.
[1] Referencing global stocks/use ratios. Stocks/Use Ratio: Ending stocks divided by total usage (i.e. consumption). Ending Stocks (also called carry-out): The amount of corn that will be available at the end of the crop year given the estimated or actual beginning stocks, production, and usage.
[2] Safrina translates to “little harvest,” which harkens back to a time when the 2nd crop was the smaller of the two. That is no longer the case, however the name has stuck.