In Like a Lion
Teucrium | February 4, 2022
Our 2022 Outlook is Playing Out Real Time
Jake Hanley, Managing Director / Sr. Portfolio Strategist
Beat-up. Bruised. Battered. Whip-sawed.
These are words investors would likely use to describe their experience over the last month. After closing at an all-time high on the first trading day of 2022, the S&P 500 Index[1] has fallen by nearly 10%. The yield on the US 10-Year Treasury bond has jumped from approximately 1.5% on December 31st to over 1.8%. The Dollar Index has advanced above the closely watched 97 level, and the S&P GSCI commodities index[2] has gained more than 10% in January.
From a macro perspective it appears likely that, at least for the near-term, investors will be dealing with an environment of rising interest rates and higher commodity prices. Volatility has increased as market participants adjust their portfolios to accommodate this new reality.
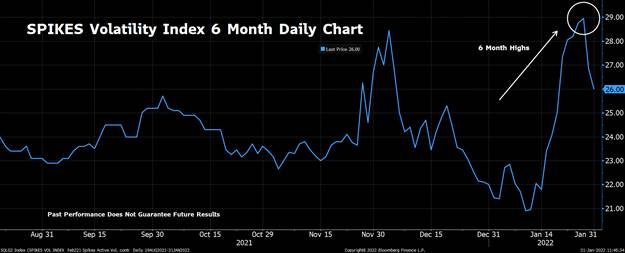
Source: Bloomberg Finance L.P. Generated on 01/31/2022. This chart is for illustrative purposes only and not indicative of any investment. Past performance does not guarantee future results. The SPIKES Volatility Index is a measure of the expected 30-day volatility in the SPDR S&P 500 ETF (SPY). For more information visit https://www.mgex.com/spikes.html
Amid periods of heightened volatility, it can be beneficial to remain focused on the big picture themes, versus the day-to-day noise.
Concerning grain markets, many of the themes we wrote about in our 2022 Outlook are playing out in real-time. Below we revisit some of those themes and identify what we’re watching for in the days ahead.
(If you haven’t read our 2022 Outlook yet, you can do so here.)
Russia / Ukrainian Tensions
One theme that is getting significant attention right now is escalating tensions on the Russian/Ukrainian border. We wrote in our 2022 Outlook that “…(a) military conflict has the potential to disrupt trade and could provide additional upward pressure on wheat prices.” On January 18th, US Press Secretary Psaki said “…we are at a stage where Russia could, at any point, launch an attack in Ukraine.” Since making those comments front-month wheat futures rose more than 10% before trading lower amid continuing diplomatic talks. Tensions are still high, and markets remain volatile as the trade weighs potential supply disruptions that could stem from a military invasion, or a myriad of punitive sanctions.
Watch for Supply Constraints Due to Sanctions and/or Military Disruptions.
Even if there is a peaceful resolution and little or no supply disruption, wheat prices may find continued support amid unfavorable weather conditions and declining US wheat production estimates.
Weather - La Nina
Another theme playing out in real-time is the ongoing La Nina, and the negative impact it is having on crops. Recall that La Nina typically results in warm/dry weather in the US Southern Plains, and dryness in Brazil and North/Eastern Argentina (more on South American weather below). This is precisely what we are seeing and the estimated impact on crop production has been sizeable.
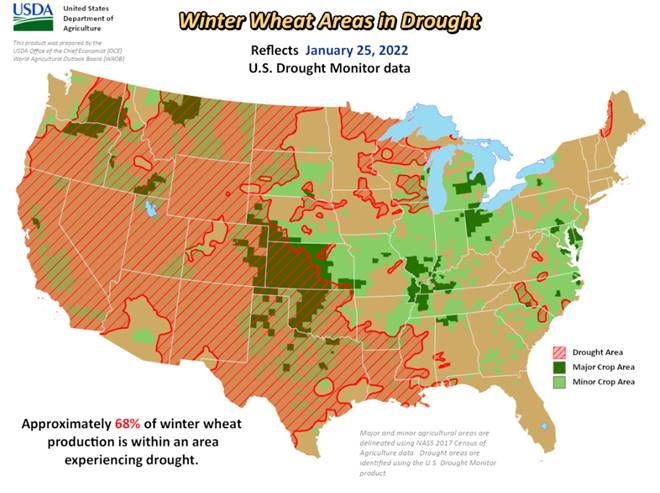
Sticking with wheat for the moment, according to the USDA, as of January 25th “…approximately 68% of the US winter wheat production is within an area experiencing drought.” Note that winter wheat represents roughly 70% of annual US wheat production. Currently, 39% of the crop is in “good” to “excellent” condition. If there is no improvement, the US winter wheat crop will be in notably worse condition versus last April when 56% of the crop was rated “good – excellent.”
Watch to See if Persistent Dry/Warm Weather Continues to Pressure Winter Wheat Production in the US Southern Plains.
The La Nina has contributed to drought conditions in South America as well. The USDA recently cut Brazil’s soybean production estimates by 3.5% to 139 million metric tons which is equal to approximately 184 million bushels. Private analysts have published even more extreme downward revisions, with some now expecting total production to come in 14 – 15 million metric tons below the USDA’s December estimates.
Watch for the Possibility of the USDA Lowering South American Soybean Production Estimates in Coming Months.
The potential hit to South American soybean production has provided a tailwind for prices. The front-month soybean futures contract is up over 10% YTD.
Biofuels and Vegetable Oil Prices
What’s more, the push to reduce fossil fuel consumption is pointing to increased demand for soybean oil as a fuel product.
We wrote in our 2022 Outlook that replacing fossil fuels for use in combustion (non-electric) engines of all types will likely require more use of agriculturally derived liquid fuels. This means soybean oil (currently a component of biodiesel) will see increased demand as new environmental policies are enacted.
As bio-fuel demand for soybean oil increases it will likely put upward price pressure on the vegetable oil complex. In fact, as of this writing, palm oil futures are trading at new all-time highs. To be certain, supply concerns appear to be the main factor impacting palm oil prices as of late. Still, palm oil and soybean prices are closely correlated[3] and higher prices for one is likely to be seen as supportive for the other.
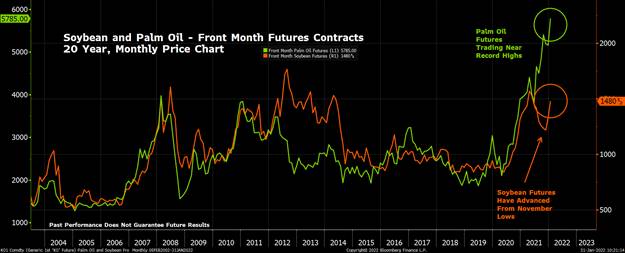
Source: Bloomberg Finance L.P. Generated on 01/31/2022. This is for illustrative purposes only and not indicative of any investment. Past performance does not guarantee future results. For this purpose, soybean commodity values are representative of the futures (generic first soybean futures contract - <S 1 Comdty>) spot continuation chart, and palm oil commodity values are representative of the futures (generic first palm oil futures contract - <KO1 Comdty>) spot continuation chart as defined by and sourced on Bloomberg
Increased vegetable oil demand for biofuels combined with palm oil supply concerns will likely continue to support soybean prices over the near term.
Watch for Policy Developments and Private Industry Investment in Renewable Biodiesel and Sustainable Aviation Fuels
Dollar Strength
Finally, the Dollar Index has resumed its uptrend over the past couple of weeks and recently moved above $97. As we wrote in our 2022 Outlook, a strengthening US Dollar can generate headwinds for US exports. However, a rising Dollar Index does not necessarily negatively impact all commodity market exports all the time. For example, we’ve seen an increased pace in Chinese purchases of US soybeans in the past two weeks.
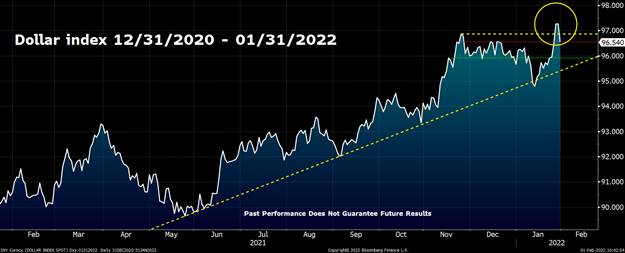
Chart: Dollar Index (DXY) 12/31/2020 – 01/31/2022. Source: Bloomberg Finance L.P. Generated on 02/01/2022. This is for illustrative purposes only and not indicative of any investment. Past performance does not guarantee future results.
There are a couple of things we need to point out here:
1. The Dollar Index is a geometrically-averaged calculation of six currencies weighted against the US Dollar. The Euro represents a large overweight at 57.6%.[4] It is important to keep in mind that currency values are always relative, and that different markets are more heavily impacted by different currency pairs.
2. While it is true that global food importers will typically “bargain hunt” to source the best price, ultimately every country is going to procure enough to fulfill their needs. For example, Brazil and Argentina cannot meet 100% of Chinese soybean demand. Therefore, China needs American soybeans.
Given the recent break above the $97 level, there is the potential for the Dollar Index to continue its upward climb. However, we do not expect Dollar Index strength to significantly impact US soybean, (or corn) exports in the near term.
Watch for the Potential for Continued Dollar Strength, Yet There May Be Limited Impact on US Soybean and Corn Exports Near-Term.
Conclusion
2022 started with a bang. There has been no shortage of market-moving headlines, and there is no reason to expect any let-up as we look out to February. At the macro level, we expect markets to remain noisy and volatile. There is certainly plenty going on in the grain markets as well. Many of the themes we wrote about in our 2022 Outlook are unfolding now in real-time.
Stay on top of grain market trends and developments by following us on Twitter (@TeucriumETFs) and subscribing to this newsletter at www.teucrium.com
Note that options are available on the Teucrium ETFs. Please consult your financial advisor and/or broker for more information
[1] The S&P 500 Index, according to Investopedia, is a market-capitalization-weighted index of 500 leading publicly traded companies in the USA.
[2] The S&P GSCI, according to Investopedia, is a composite index of commodities that measures the performance of the commodities market.
[3] 0.74 Correlation Coefficient, over 20 years using month-end prices from February 2002 and January 2022. Data Source: Bloomberg Finance L.P.
[4] https://www.theice.com/publicdocs/futures_us/ICE_Dollar_Index_FAQ.pdf