Diversification When It Matters Most
Teucrium | January 7, 2022
Grains in Your Portfolio
Jake Hanley, Managing Director / Sr. Portfolio Strategist
Where were you the last time the S&P 500 corrected by 10% or more? If you can’t remember, don’t worry, you’re not alone. After all, it’s been nearly 2 years since the last stock market correction.[1]
The last time the stock market declined by more than 10% was between February 19, 2020, and March 23, 2020. This was the COVID crash. During that period, the S&P 500 Total Return Index declined by 34%, from peak to trough. Since then, there have been modest stock market pullbacks and retracements, but nothing more than 10%.
Historically speaking, we are overdue for a correction. Since 1928, a correction of 10% or more has occurred once every 19 months or so.[2] The stock market does appear to be on edge. The S&P 500 reached a new intra-day high on January 4th and has since fallen by more than 2%. The recent chatter is all about the Federal Reserve’s hawkish tone around the prospect for higher rates in 2022. Whether or not we are at the beginning of a 10%+ stock market correction is anyone’s guess. Yet, it might be a good time to review your portfolio allocation and examine how different asset classes behave during stock market selloffs.
Grains in Focus
The GSCI Grains Index has outperformed stocks in 10 out of the last 11 stock market corrections of 10% or more. Over the course of the most recent correction, the GSCI outperformed the S&P 500 by more than 29%. What’s more, the Teucrium Benchmark Indexes for CORN, WEAT, and SOYB all outperformed during this period as well. The WEAT Fund Benchmark Index held up the best and outperformed the S&P 500 Total Return Index by nearly 32%. Both CORN and the SOYB Benchmark Indexes outperformed by approximately 25% and 28% respectively.[3] To be certain the GSCI Grains Index as well as the Teucrium Benchmark Fund Indexes were all down, just not down as much. Still, relative performance is important, especially in a down market when not losing as much as the overall market is counted as a win in the investment world.

Forward Expectations
Whether grains continue to outperform during market corrections is anybody’s guess. Yet, fundamentally speaking, there is good reason to expect that they might. After all, grains are food and food demand is largely inelastic. You are not likely to skip your breakfast bagel simply because the stock market is in a correction. This is one reason why wheat prices held up so well during the initial COVID crisis.
Additionally, grain price fundamentals are in many ways different from stock market fundamentals. Weather, for example, is a major factor in grain production. Unfavorable weather has the potential to lead to a reduction in grain supply. Lower supplies typically put upward pressure on prices. But weather typically has very little influence if any on stock valuations. A drought in Kansas is not likely to have a significant impact on the price of Apple’s stock.
Furthermore, the data suggests that grain prices may continue to outperform stocks during market corrections. While history does not guarantee future results, grain prices historically have relatively low correlations when compared to the S&P 500. Correlation measures the degree to which assets move in relation to each other. Correlations are expressed through the correlation coefficient which ranges from a scale between -1 and 1. A correlation of -1 suggests that the assets will move opposite from one another, whereas a correlation 1 means they will move in tandem. A correlation of 0 means that there is no observable relationship between the price movements of the assets.
The chart below is a 20-year study of correlations between various commodities and the S&P 500. Note that the grains all have very low correlations to the S&P 500. This suggests grain prices tend to move independently from stock prices. Importantly the correlation is not negative. Thus, when stocks are going up, grains might be expected to go up as well. Additionally, as we saw above, when stocks go down, grain prices may also go down. But historically, grains have often gone down by a lesser degree.
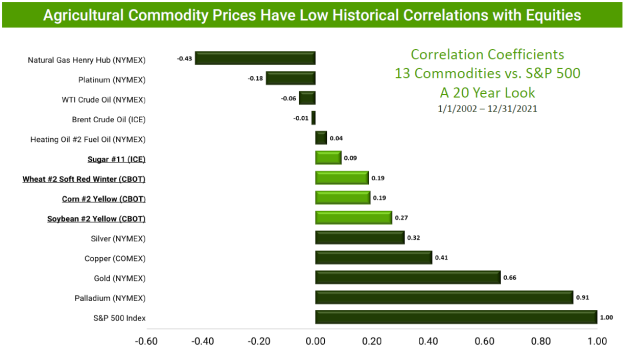
This is for illustrative purposes only and not indicative of any investment. Analysis and corresponding graphics were prepared by Teucrium, using Bloomberg Financial L.P. January 6, 2022.
Note: Commodity values are from futures (generic first) spot continuation charts. S&P 500 Index taken from Bloomberg: SPX Index – An investment cannot be made directly in an index
Conclusion
It’s been nearly 2 years since the last stock market correction of 10% or more. Given the hawkish tone coming from the Federal Reserve, we may see a stock market correction sooner rather than later. The GSCI Grains Index has outperformed stocks in 10 out of the last 11 stock market corrections.[4] Grain prices are related to their own unique internal market fundamentals and are not closely tied to stock prices. This is reflected in the data which shows relatively low correlations between the grains and the S&P 500. While history cannot guarantee future results, the data suggest that allocating to grains may result in a more resilient portfolio. That is, grains, historically have provided the benefits of diversification precisely at the time when it matters most.
[1] We refer to a correction as being a stock market decline of 10% or more.
[2] https://www.forbes.com/advisor/investing/prepare-for-market-correction/
[3] According to Data from Bloomberg Finance L.P. Benchmarks referenced: TCORN Index = Teucrium Corn Fund Benchmark Index, TWEAT Index = Teucrium Wheat Fund Benchmark Index, TSOYB Index = Teucrium Soybean Fund Benchmark Index. Performance measured between February 19, 2020, and March 23, 2020.
[4] Stocks: As measured by the S&P 500 Total Return Index