Santa Clause Rally or Something More?
Teucrium | December 29, 2021
Soybean Futures Prices Rally in December
Jake Hanley, Managing Director / Sr. Portfolio Strategist
The soybean prices have been moving higher over the past few weeks. Soybean futures are up over 13% over the last 6 weeks, with the front-month contract trading well over the psychological level of $13.00.
While trade volume is declining as we head into the holidays, weather concerns are on the rise. In our recently published 2022 Grains Outlook (available here) we discussed the potential of the La Nina weather pattern to negatively impact South American crop production. The excessively dry conditions that typically accompany a La Nina weather pattern are beginning to emerge, and the current two-week forecast provides little hope for rain.
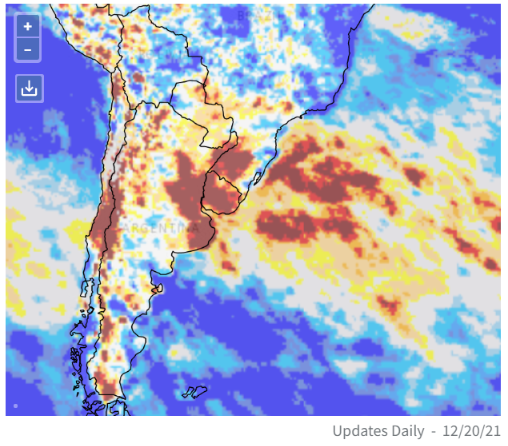
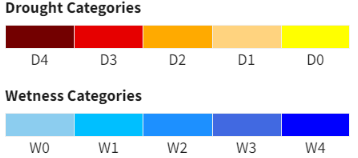
What’s more, the areas experiencing the driest conditions are key soybean growing areas. NOAA’s international drought map (below) shows the dry conditions extending from Southern Brazil through the Santa Fe & Buenos Aires regions of Argentina. That suggests that up to approximately 32% of the Brazilian soybean production area could be impacted. It’s worse for Argentina where it appears that as much as 40% of the soybean growing areas is experiencing dryness.
Soybean market participants are already on edge given the relatively tight global supplies. The USDA is estimating a decrease in the global stocks/use ratio for soybeans in the 2021-2022 crop year. Note, Argentina and Brazil account for approximately 50% of global soybean production, and roughly 57% of global soybean exports. Global soybean supplies are already low relative to expected demand. A lower revision of South American soybean production likely would lead to an even tighter supply situation.
Seasonal factors might be at play here as well. The chart below shows soybean price trends over both the 20- and 30-year periods. Note that historically soybean prices reach their calendar year lows in October and rally through the end of the year. The seasonal chart clearly shows that on average, soybean prices rally through the month of December.
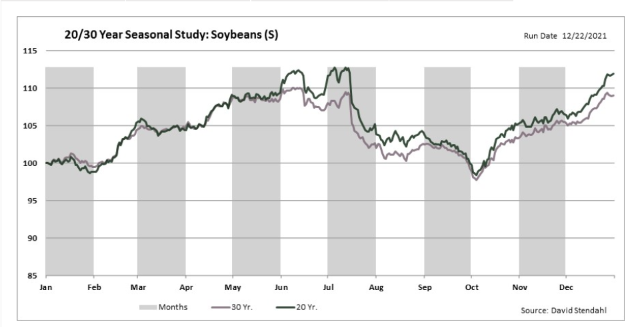
Source: Signal Trading Group (www.signaltradinggroup.com) Used with permission. Past performance is not indicative of future results.
*About the Data: The seasonal chart above provides a historic reference of past trends for the corn market. Average prices over the 20 and 30-year periods are reflective of daily 1st month (spot month) contract data from January 1, 1991 to December 31, 2020.
Feel free to call it a Santa Clause rally if you’d like. However, we believe soybean prices are reacting to drought related South American production concerns. Additionally, the strength in the seasonal price pattern suggests that prices have been following the path of least resistance over December. To be certain, market participants will be watching the weather carefully in the coming days and weeks. We would expect prices to come under pressure There is a risk that prices move lower from here. is plenty of downside risk, especially given how far prices have advanced over the past few weeks. Longer-term, we expect soybean prices to remain volatile at least through the first part of 2022.