A World in Turmoil – Peak Grains
Jake Hanley, Managing Director | February 28, 2023
Since the turn of the millennium, combined corn, soybean, and wheat consumption has increased by more than 73%. As we discussed in the preceding installment of “A World In Turmoil,” grain demand is largely driven by population growth and an expanding global middle class. Demand for grains remains robust and on a steady trajectory higher.
Production, while variable from year to year, has, for the most part, been keeping up. Yet, producing enough food to meet ever-increasing demand is becoming more and more difficult. Thankfully, grain production has advanced significantly in key areas of the world, namely South America, and the Black Sea region. If not for the increased production in these areas, our food systems would look very different today.
Still, further production increases are necessary to keep up with population growth and increasing demand. In fact, over the past few years, combined corn, wheat, and soybean consumption has outpaced production. Global inventories have been drawn down, and food prices remain near 12-year highs.
Chart 1
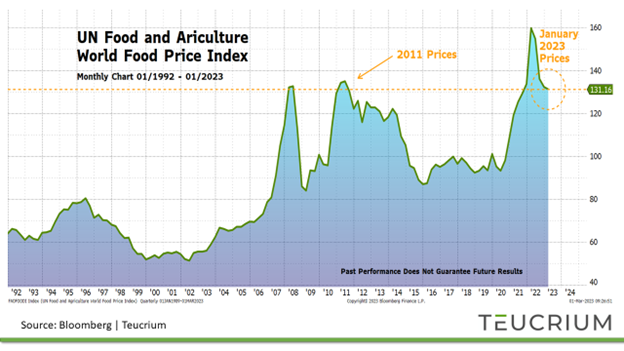
This chart is for illustration purposes only and is not indicative of any investment.
Below we will review the recent history of global grain production, identify the key players in the global export markets, and discuss the persistent challenge of keeping up with demand.
More is Better
When it comes to food production, more is better. Annual global production of corn, wheat, and soybeans has increased by more than 150% since 1980. This is quite an accomplishment considering that the total area harvested has only increased by approximately 33% over the same period. In other words, more food is being grown per acre. In fact, scientific gains and advanced industrial farming methods have led to an approximate 84% jump in the global average yield per acre since 1980.[1]
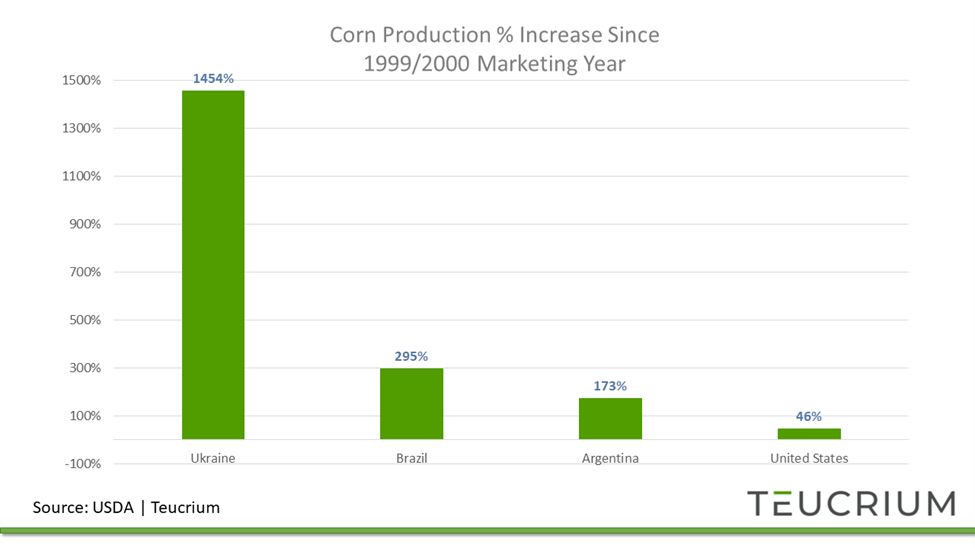
Corn
Since the 1999-2000 crop year, Ukraine, Brazil, and Argentina have all more than doubled their corn production. Ukraine has led the gains jumping more than 1400% over the past 23 years.
Chart 2
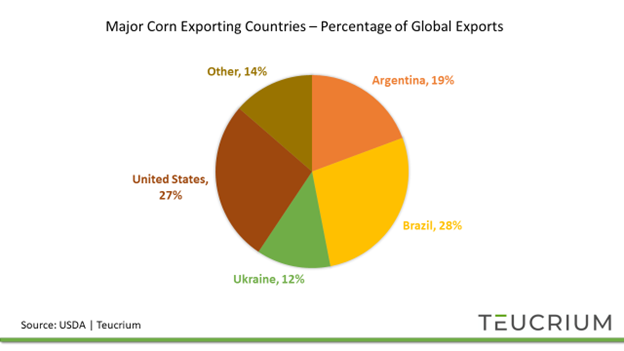
The production increases have gone a long way to meeting the global corn demand. For the ’22-’23 marketing year the USDA projects that Ukraine, Brazil, and Argentina will account for nearly 60% of global corn exports. In fact, four countries (Ukraine, Brazil, Argentina, and the USA) make up 86% of the world’s corn export market.
Chart 3
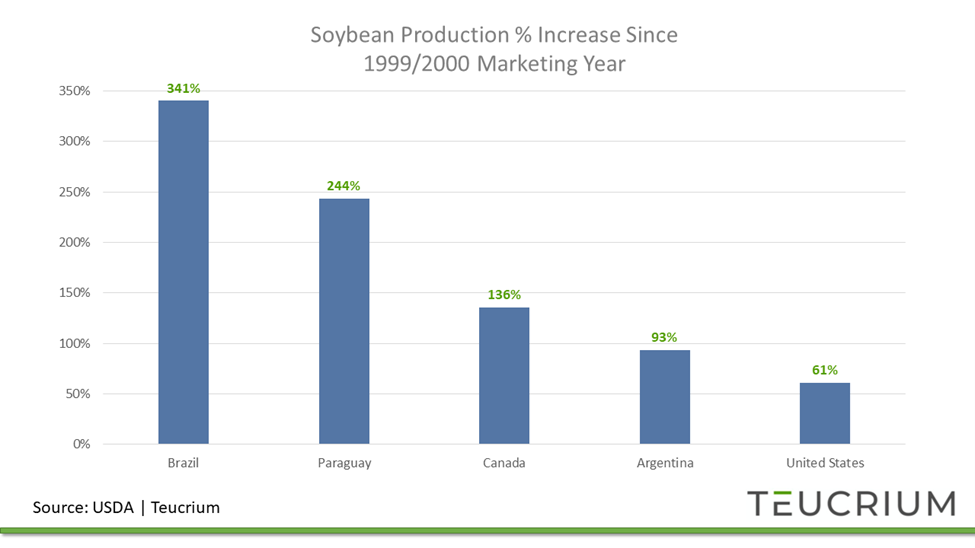
Soybeans
One cannot overstate the importance of South America in the global soybean market. Brazilian soybean production is up 341% since the 1999 – 2000 crop year. Paraguay’s soybean production is up 244% and Argentinian soybean production has nearly doubled over the same period.
A 61% increase in US soybean production is also impressive considering that total US soybean acres harvested have only grown by 19% compared to a 219% increase in acres harvested for Brazil.[2]
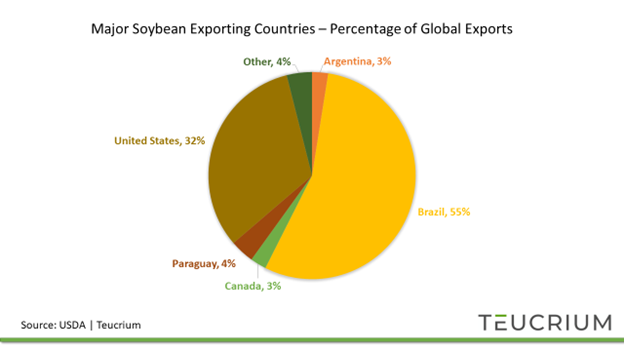
Chart 4
Given the significant increases in production, Brazil has become the world’s largest soybean exporting nation, accounting for more than 55% of global exports.[3] The US remains the world’s second-largest soybean exporter, and the two countries increasingly find themselves competing for sales to China (the world’s largest importer).
Chart 5
Wheat
The story is much different for wheat. Wheat is primarily grown for human consumption, whereas the majority of corn and soybean production is used for animal feed, ethanol production, and a wide variety of other industrial purposes.
As such, the average per-person consumption of wheat has remained relatively steady over the years. Global wheat usage, therefore, is very closely related to population growth. Based on current UN projections, Asia and Africa are expected to experience the highest rates of population growth through the year 2050.[4]
At present, Asia (including China)[5] accounts for roughly 35% of global wheat production, whereas Africa accounts for roughly 3% of global wheat production. Countries in Asia and Africa experiencing high population growth rates will either need to ramp up domestic wheat production or increasingly rely on imports. Given that Russia is the world’s single largest wheat-exporting nation, the food security of many nations, mostly in Africa, may become ever more dependent on Russia.
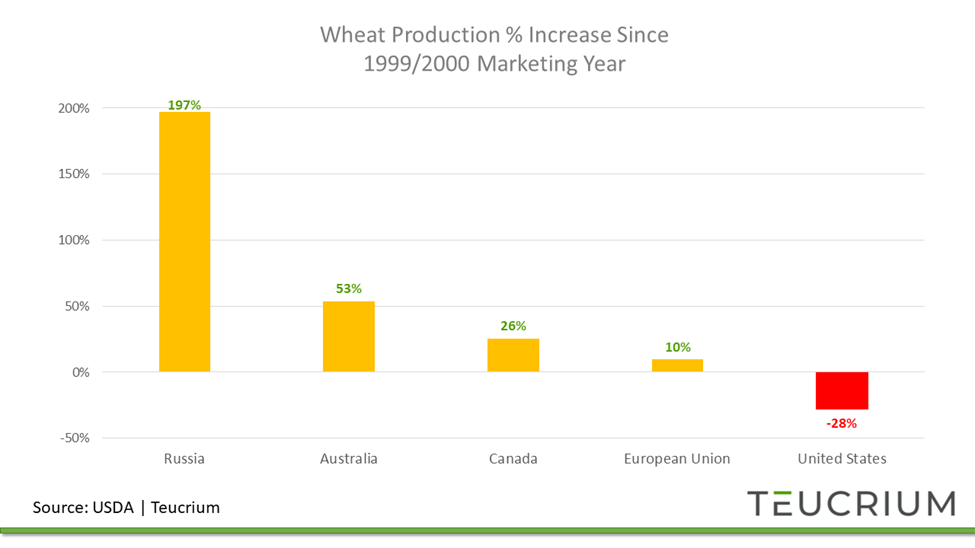
Note that Russia’s wheat production has increased by nearly 200% since the turn of the millennia. Compare that with US wheat production which has declined by 28%.
Chart 6
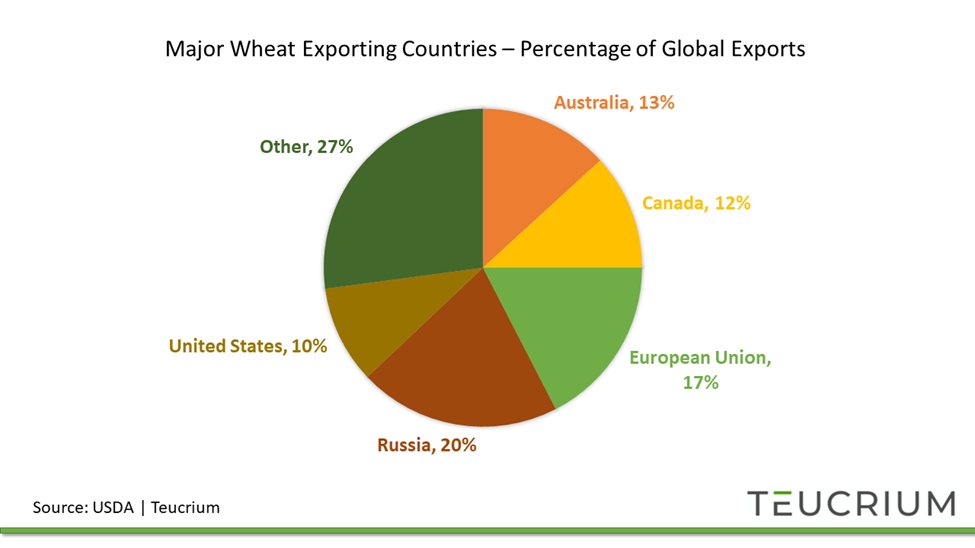
Still, the US, Canada, and the EU combined makeup nearly 40% of global wheat exports. This means that the majority of NATO countries’ combined wheat exports are almost double that of Russia. Make no mistake, in a war for global influence, be it a cold or hot war, the ability to provide food security matters!
Chart 7
Food security depends on the world’s famers’ continued ability to keep pace with global demand. As mentioned above, unfortunately, production has lagged as of late.
Peak Grains
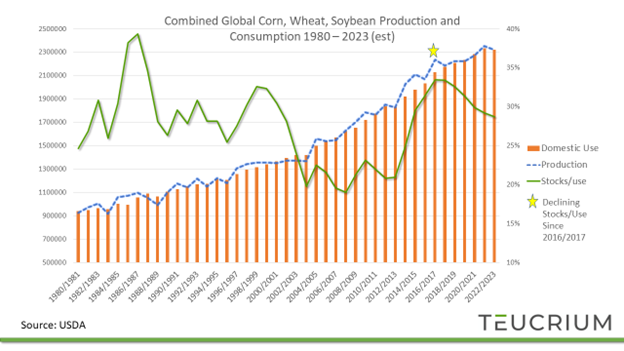
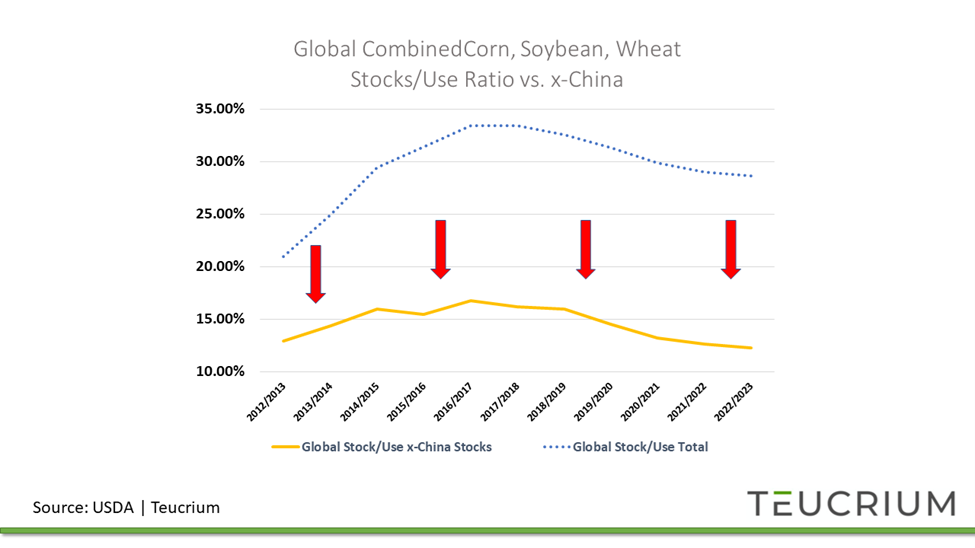
Since the 2017-2018 crop year, usage, i.e. consumption, has largely outpaced production. We can see this relationship most clearly in the stocks-to-use ratio. Stocks, also referred to as ending stocks, represent the amount of grain left over at the end of a crop year. In years when production exceeds consumption ending stocks increase. In years when consumption exceeds production, ending stocks decline.
The stocks/use ratio measures ending stocks in relation to expected use. Higher values reflect larger supplies relative to usage, and lower values are indicative of smaller supplies relative to demand.
As you can see on the chart below, the global combined stocks/use ratio for corn, wheat, and soybeans (green line ) most recently peaked in the 2016/2017 crop year and has been declining ever since.
Chart 8
The picture becomes somewhat more concerning when you account for the fact that nearly 57% of the world’s combined corn, soybean, and wheat supplies reside in China. China is a major grain consumer and importer. This means that the grains that are in China are not leaving China. In other words, Chinese supplies are not available to global export markets.
Additionally, there is a question as to whether the official Chinese numbers can be taken at face value. It is entirely possible that China does not have the amount of grain that it is officially reporting.
Note that when you remove Chinese supplies from the global balance sheet but keep Chinese demand in the equation, the global stocks/use ratio for corn, wheat, and soybeans registers a 10-year low.
Chart 9
This matches the price behavior for the three grains which recently were trading near 10-year highs in 2022. Market pricing indicates sustained Chinese demand, regardless of whether China holds 57% of the world's grain supplies or not.
Chart 10
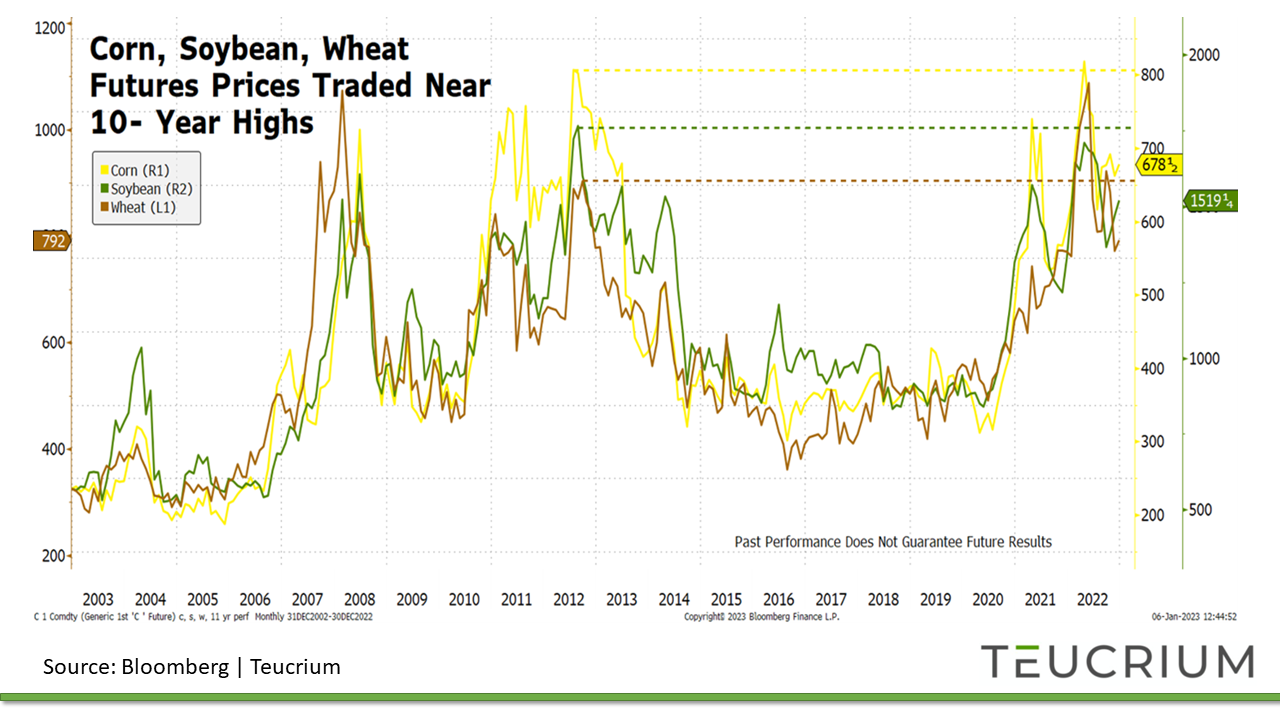
This chart is for illustration purposes only and is not indicative of any investment.
Looking Ahead
The 2023 – 2024 crop year will be critical when it comes to restoring global grain balance sheets. There is reason to be optimistic.
The production shortfalls over the past few years have largely been due to adverse weather. La Nina climate conditions, which have weighed on production for the past 2 ½ years, appear to be dissipating. La Nina conditions typically create adverse weather patterns for key crop production areas in North and South America. With La Nina on its way out, grain analysts are optimistic that farmers can produce record crops in the coming year.
Yet, optimism comes easy this early in the year. US farmers have not even begun planting corn and soybeans, and the release of the USDA’s first official 2023-2024 is still two months away.[6]
We expect that weather will likely be the biggest variable this coming year. Should the weather cooperate, then we just may see record production, and grain prices trending lower in response.
Still, we cannot discount the potential for uncooperative weather in key growing areas, or for increasing geo-political tensions to disrupt markets and apply upward pressure on grain prices. Afterall, it remains a world in turmoil.
[1] https://apps.fas.usda.gov/psdonline/app/index.html#/app/home
[2] USDA PSD Online https://apps.fas.usda.gov/psdonline
[3] USDA PSD Online based on latest data available 02/28/2023
[5] Chinese wheat production accounts for roughly half of all Asian wheat production.
[6] The USDA’s May WASDE Report is due to be released on May 12, 2023